
A very interesting study that demonstrates the PCR signal as a complementary sentiment tool, showing there is a genuine signal embedded in the data.
SMC Special Update 08-11-26: A quantitative Volume Put/Call Ratio Analysis on SPY
This study examines the Volume Put/Call Ratio for SPY, with the objective of evaluating whether extreme readings provide statistically useful contrarian trading signals.
Introduction
The Volume Put/Call Ratio is calculated by dividing the volume of put options traded by the volume of call options traded:
Put/Call Ratio = Put Option Volume / Call Option Volume
For example, if 800,000 put contracts and 1,000,000 call contracts are traded during a session:
PCR = 800,000 / 1,000,000 = 0.80
A ratio of 0.80 therefore means that 80 put contracts were traded for every 100 call contracts. However, put activity is not necessarily bearish, nor is call activity necessarily bullish. Traders may buy puts as portfolio insurance, sell puts as part of an income strategy, hedge futures positions with options, or trade multi-leg option spreads. For this reason, the Put/Call Ratio is generally more useful as an indicator of market sentiment and sentiment extremes than as a literal measure of bullish versus bearish positioning.
The indicator and the strategy for TradeStation can be downloaded following this link: VOLUME PUTCALL RATIO ANALYSIS.zip
Please let us know in the comments, if there is demand for a TradingView version.
Study Methodology
The objective of this study is to identify unusually bullish or bearish readings in the Volume Put/Call Ratio and evaluate the performance of theoretical trades that fade these sentiment extremes.
Although the Put/Call Ratio itself generally fluctuates within a relatively well-defined range, its typical level changes over time. Periods of persistently higher or lower readings can be observed, making fixed sentiment thresholds potentially less effective across different market environments.
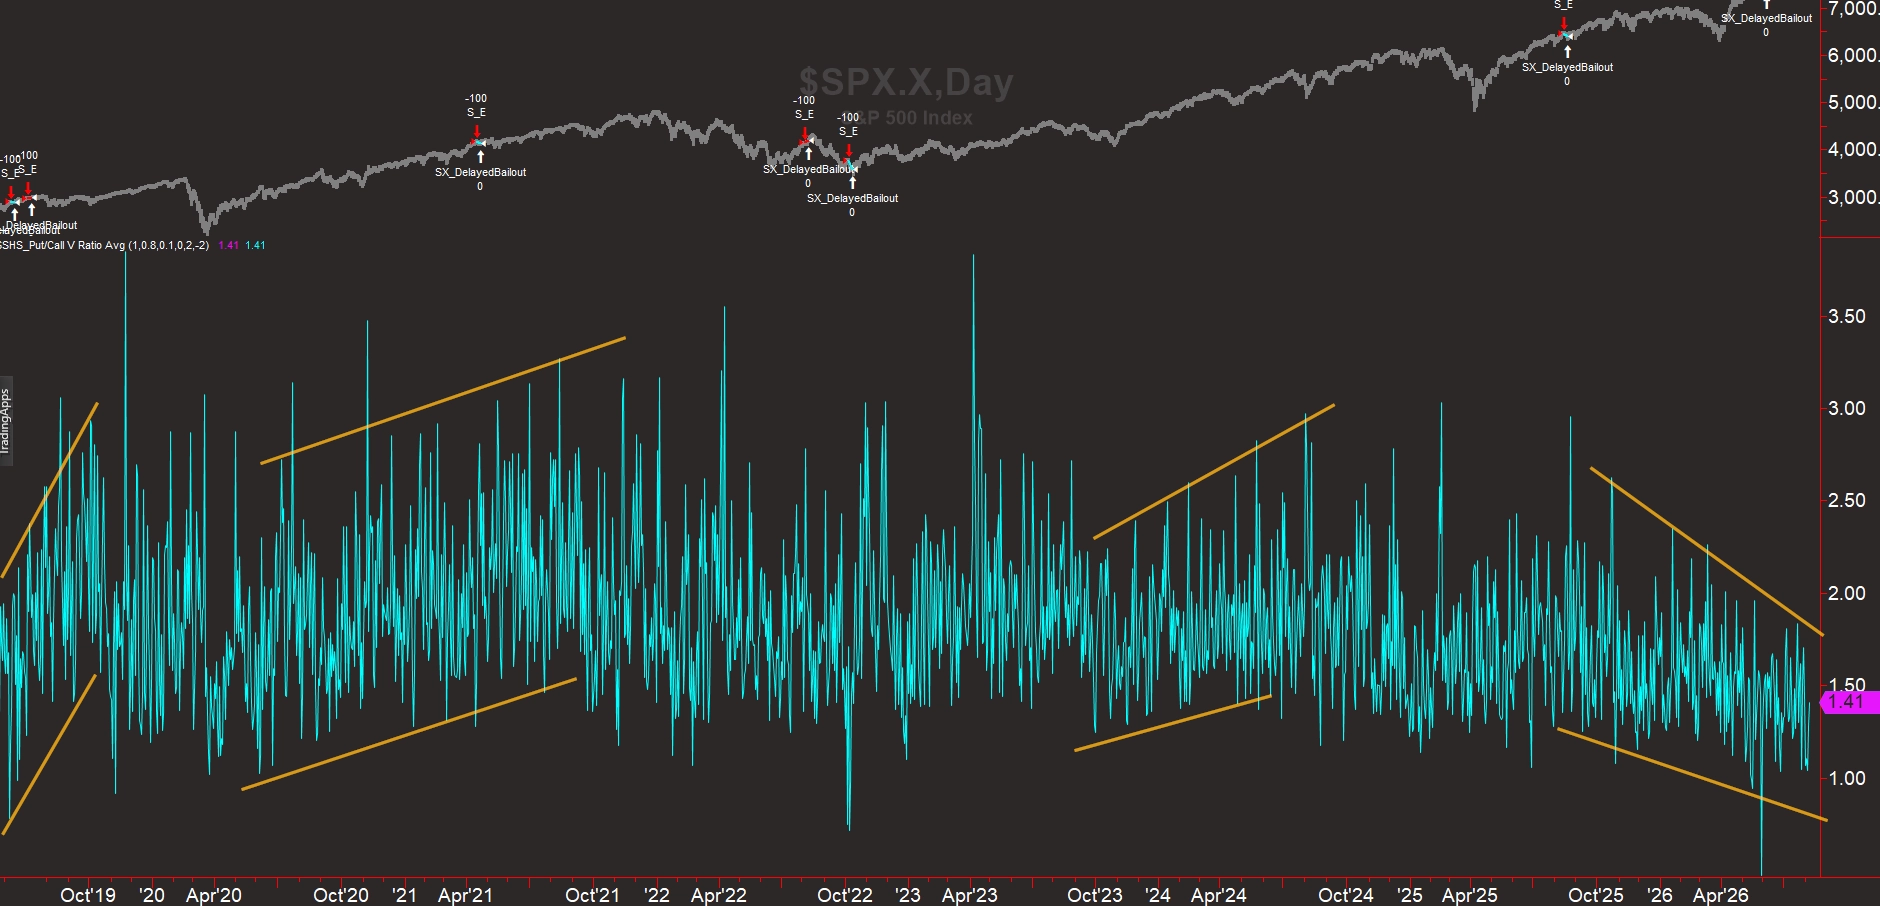
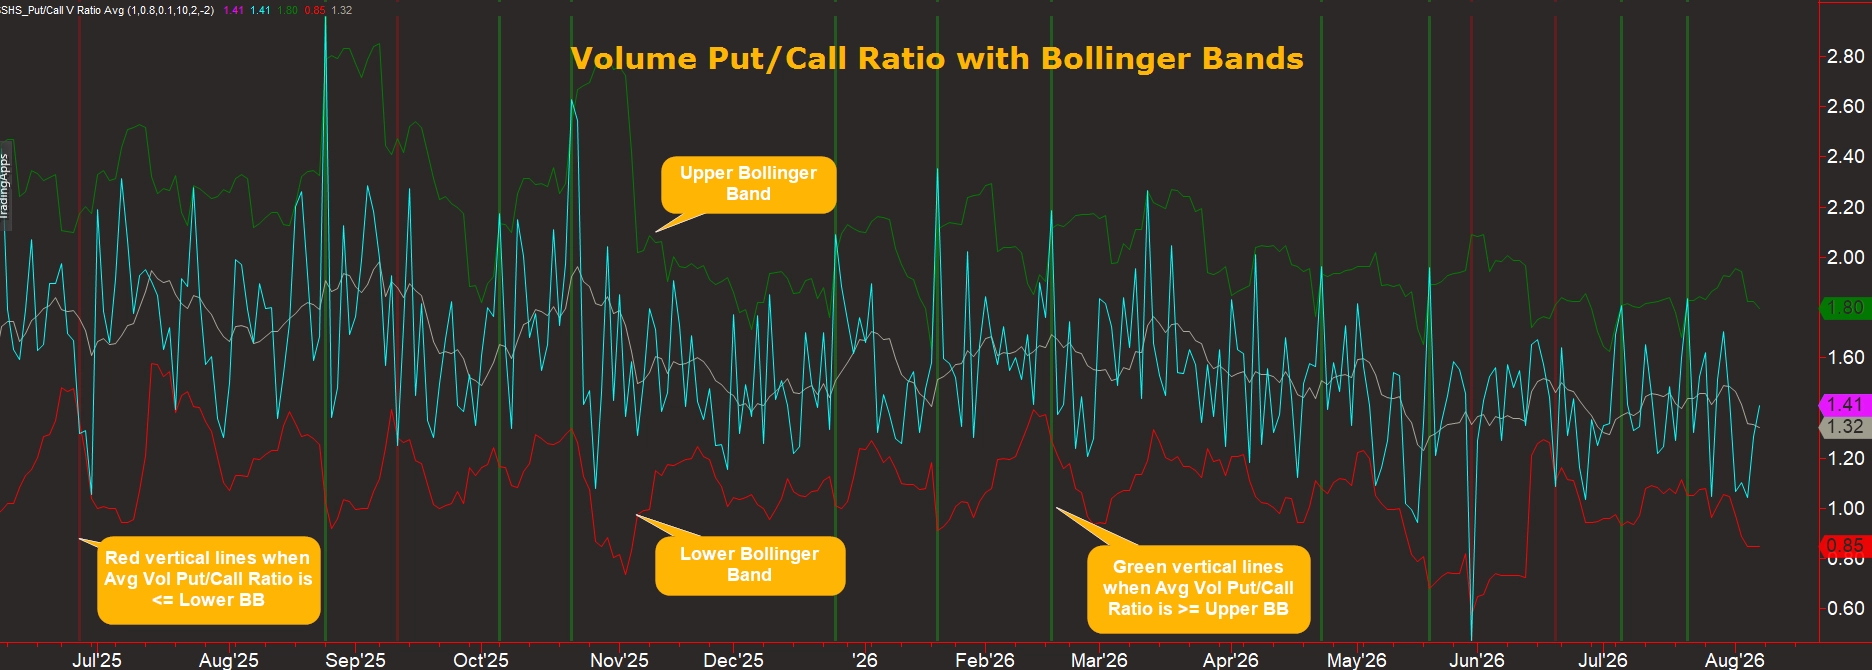
Rather than defining fixed thresholds for bullish and bearish sentiment, Bollinger Bands are therefore used to create a dynamic, context-sensitive envelope around the Put/Call Ratio.
In addition, the raw Volume Put/Call Ratio can first be smoothed using a Simple Moving Average. The Bollinger Bands are then calculated around the resulting smoothed series.
To evaluate the signals quantitatively, a systematic trading strategy is applied to the indicator. A broad range of parameter combinations is tested in order to examine the robustness of the approach rather than relying on a single arbitrarily selected configuration.
The optimization evaluates the Cartesian product of all parameter values, resulting in a backtest for every possible parameter combination.
The following parameters are tested:
- Average Volume Put/Call Ratio Length (iMALength): 1, 5, 10, 15, 20A value of 1 effectively uses the raw Put/Call Ratio without additional smoothing.
- Bollinger Band Moving Average Length (IBBLength): 6, 9, 12, 15, 18, 21, 24
- Bollinger Band Standard Deviations Up (iBBNumDevsUp): 1.5, 2.0, 2.5, 3.0Used only for the long-side tests.
- Bollinger Band Standard Deviations Down (iBBNumDevsDn): -1.5, -2.0, -2.5, -3.0Used only for the short-side tests.
- Exit Bars: (iExitBars) 0, 1, 2, 3, 4, 5, 6, 7, 8
This produces 1,260 parameter combinations for each trade direction.
The Exit Bars parameter is used to evaluate different holding periods. A position is entered at the opening of the session following a signal. An Exit Bars value of 0 closes the position at the end of the entry session, while higher values extend the holding period by the corresponding number of sessions.
The backtest is trading 100 shares on each trade and is run from July 1st 2007 to August 7th 2026.
Results and Interpretation
All results are filtered to include only tests that generated at least five trades.
SPY Long
The SPY long-side analysis is presented in greater detail to illustrate the analytical process and the tools used to evaluate the results. The short side is analyzed using the same methodology, but its section will focus more directly on the results, allowing readers to draw their own conclusions.
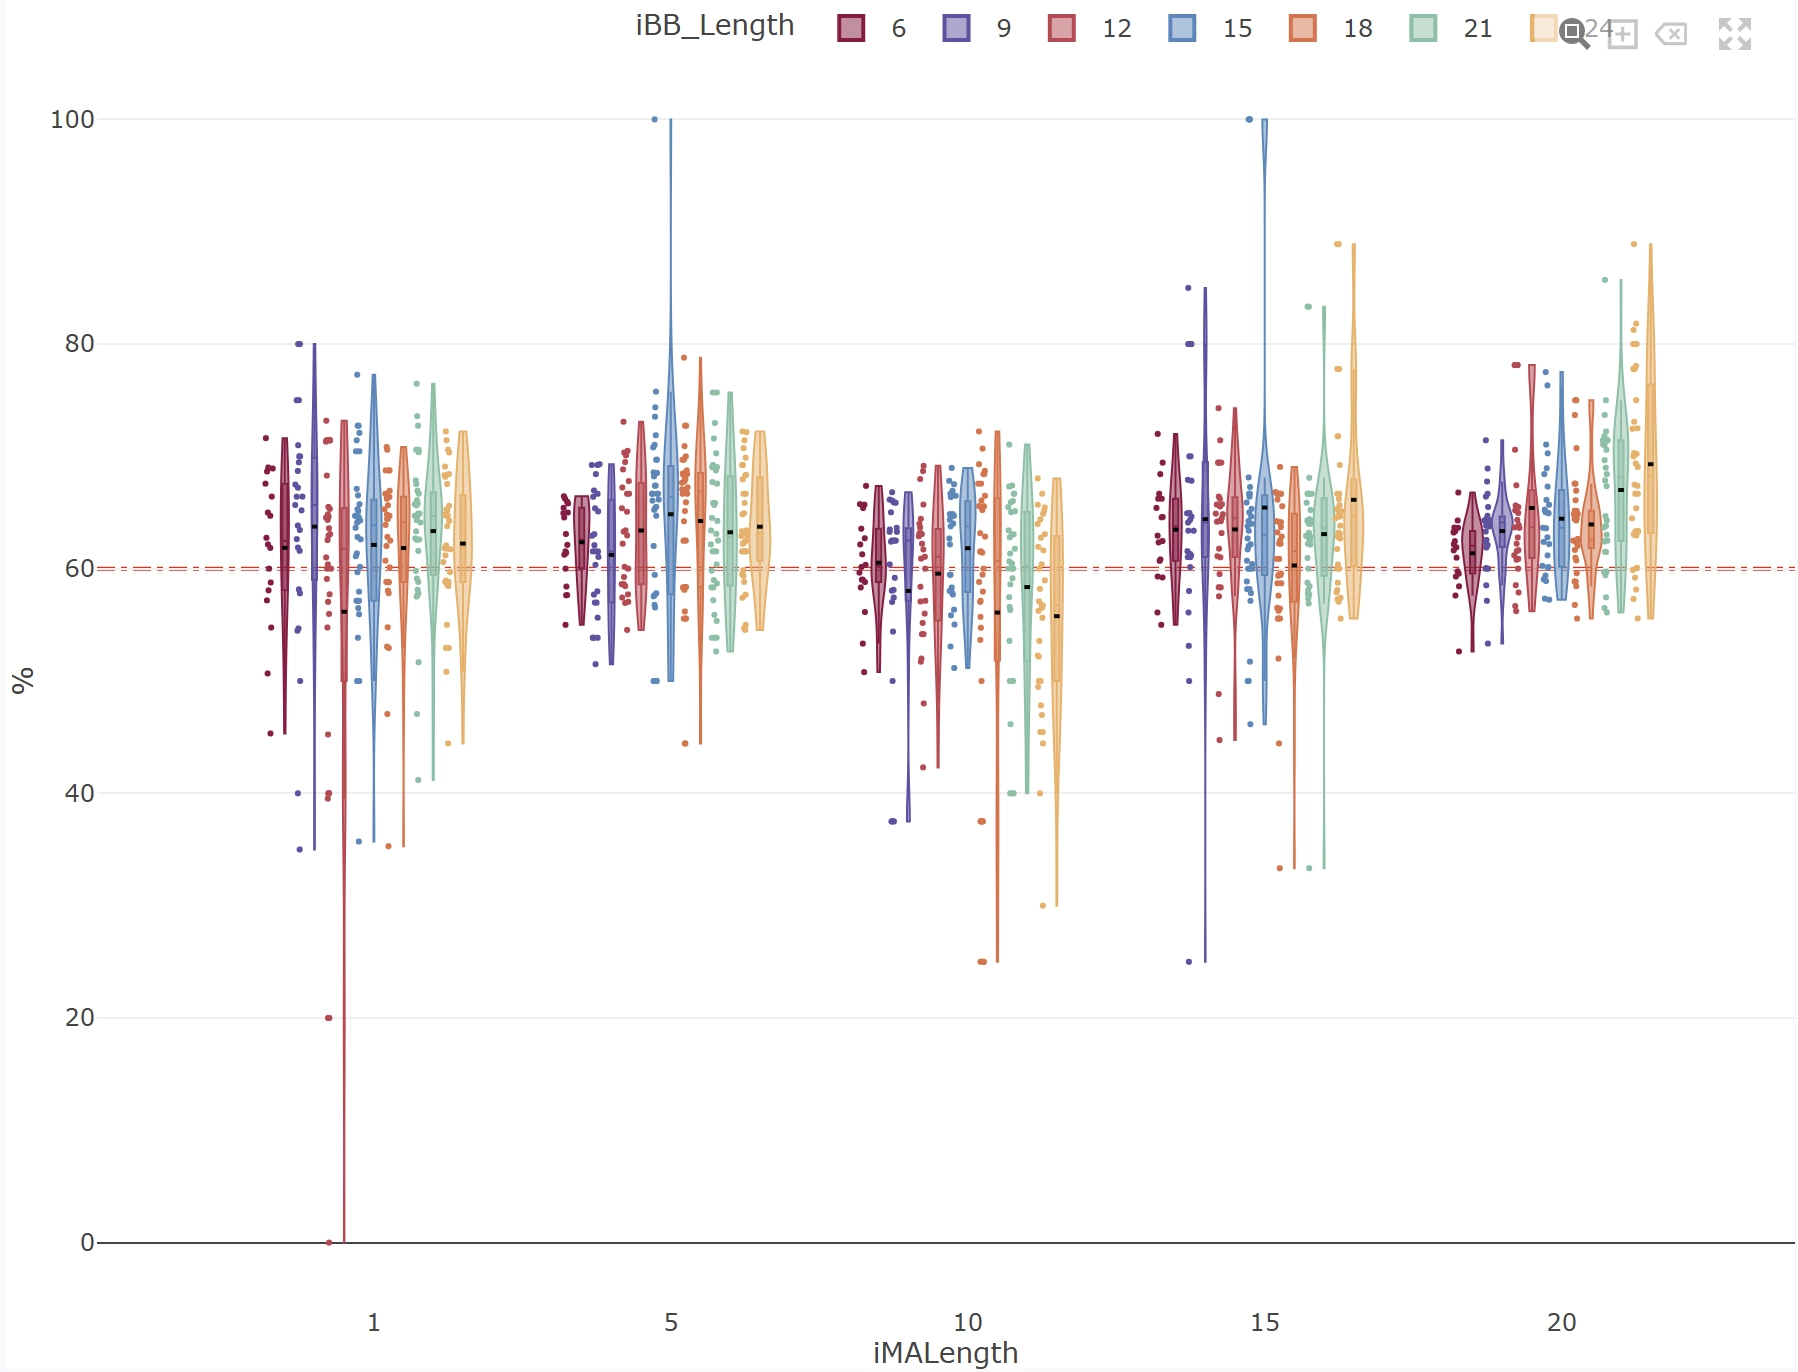
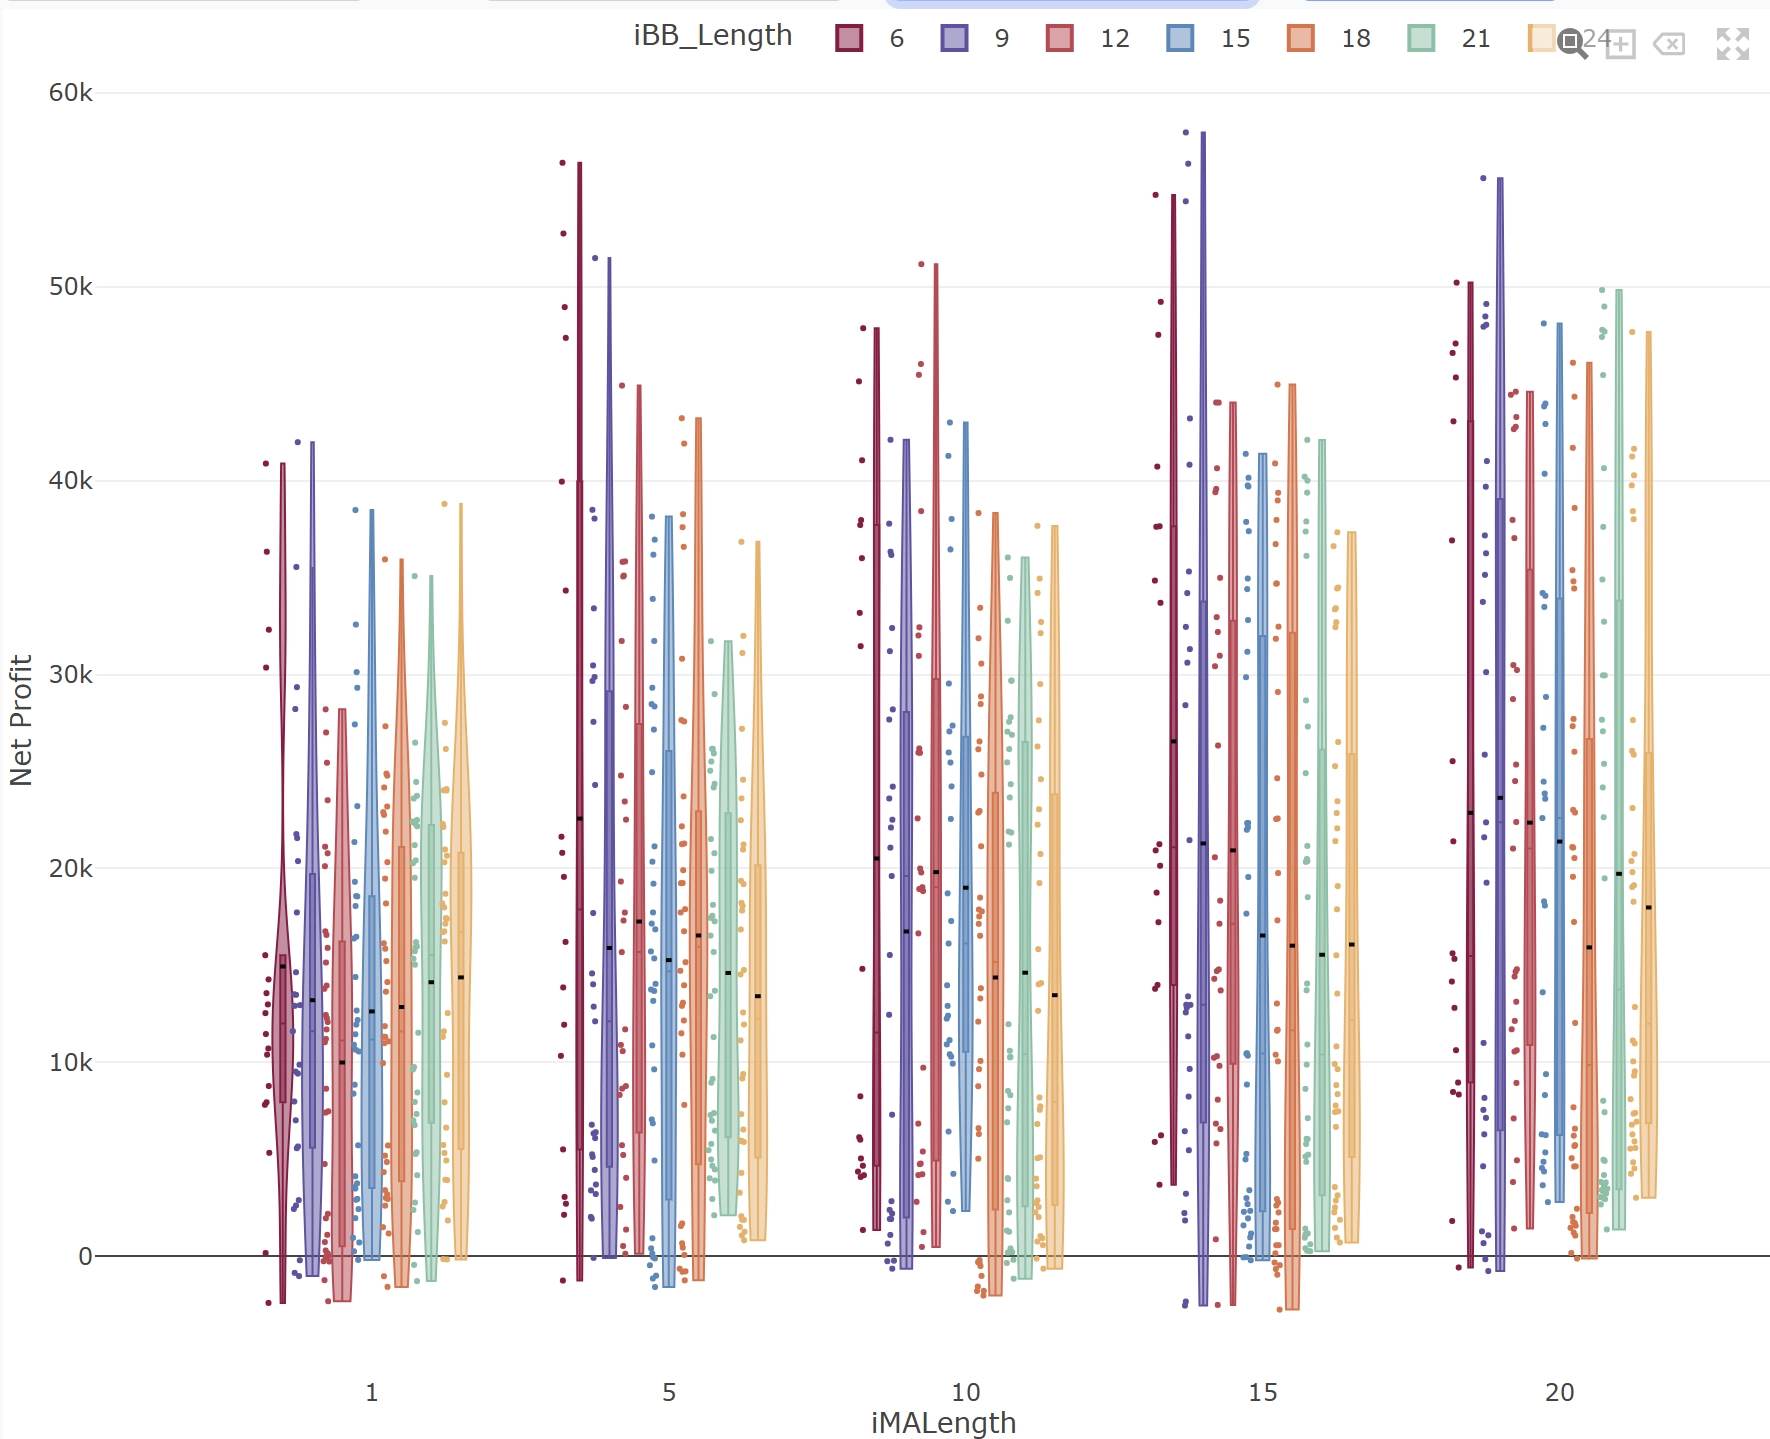
Given the large number of test results (1,260 parameter combinations), the analysis begins with an aggregated, top-down approach. We first examine two of the most influential parameters: iMALength (Average Volume Put/Call Ratio Length) and iBBLength (Bollinger Band Moving Average Length).
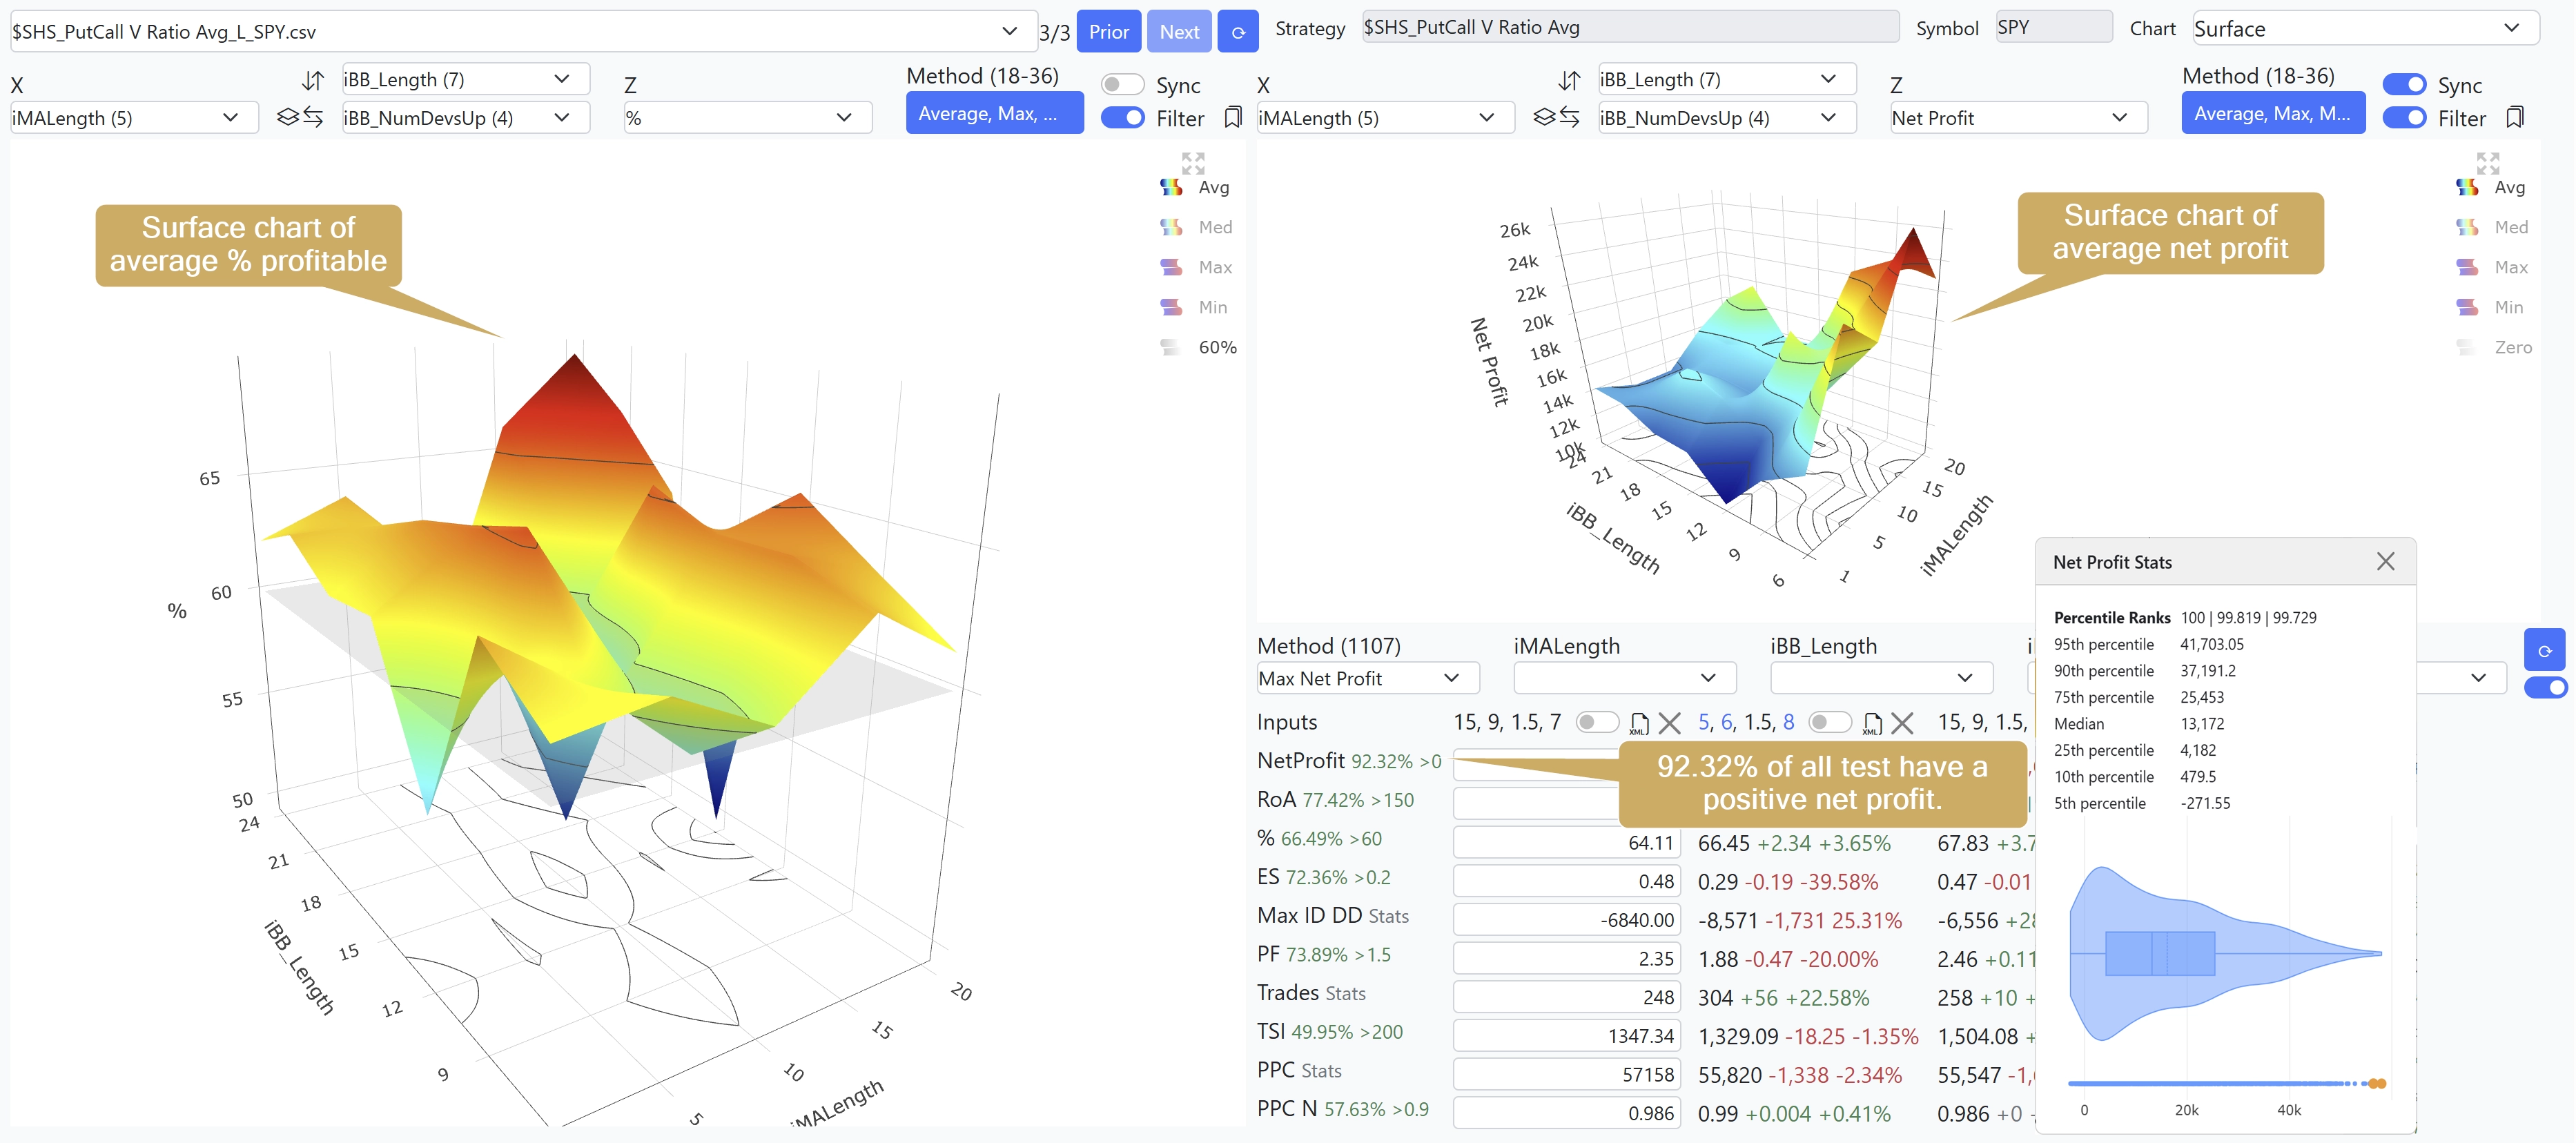
The majority of parameter combinations produce a positive net profit. However, this result must be interpreted in the context of the long-term upward bias of the equity market, which naturally favors long-only strategies.
A review of the aggregated input-combination statistics supports the observations from the surface charts.
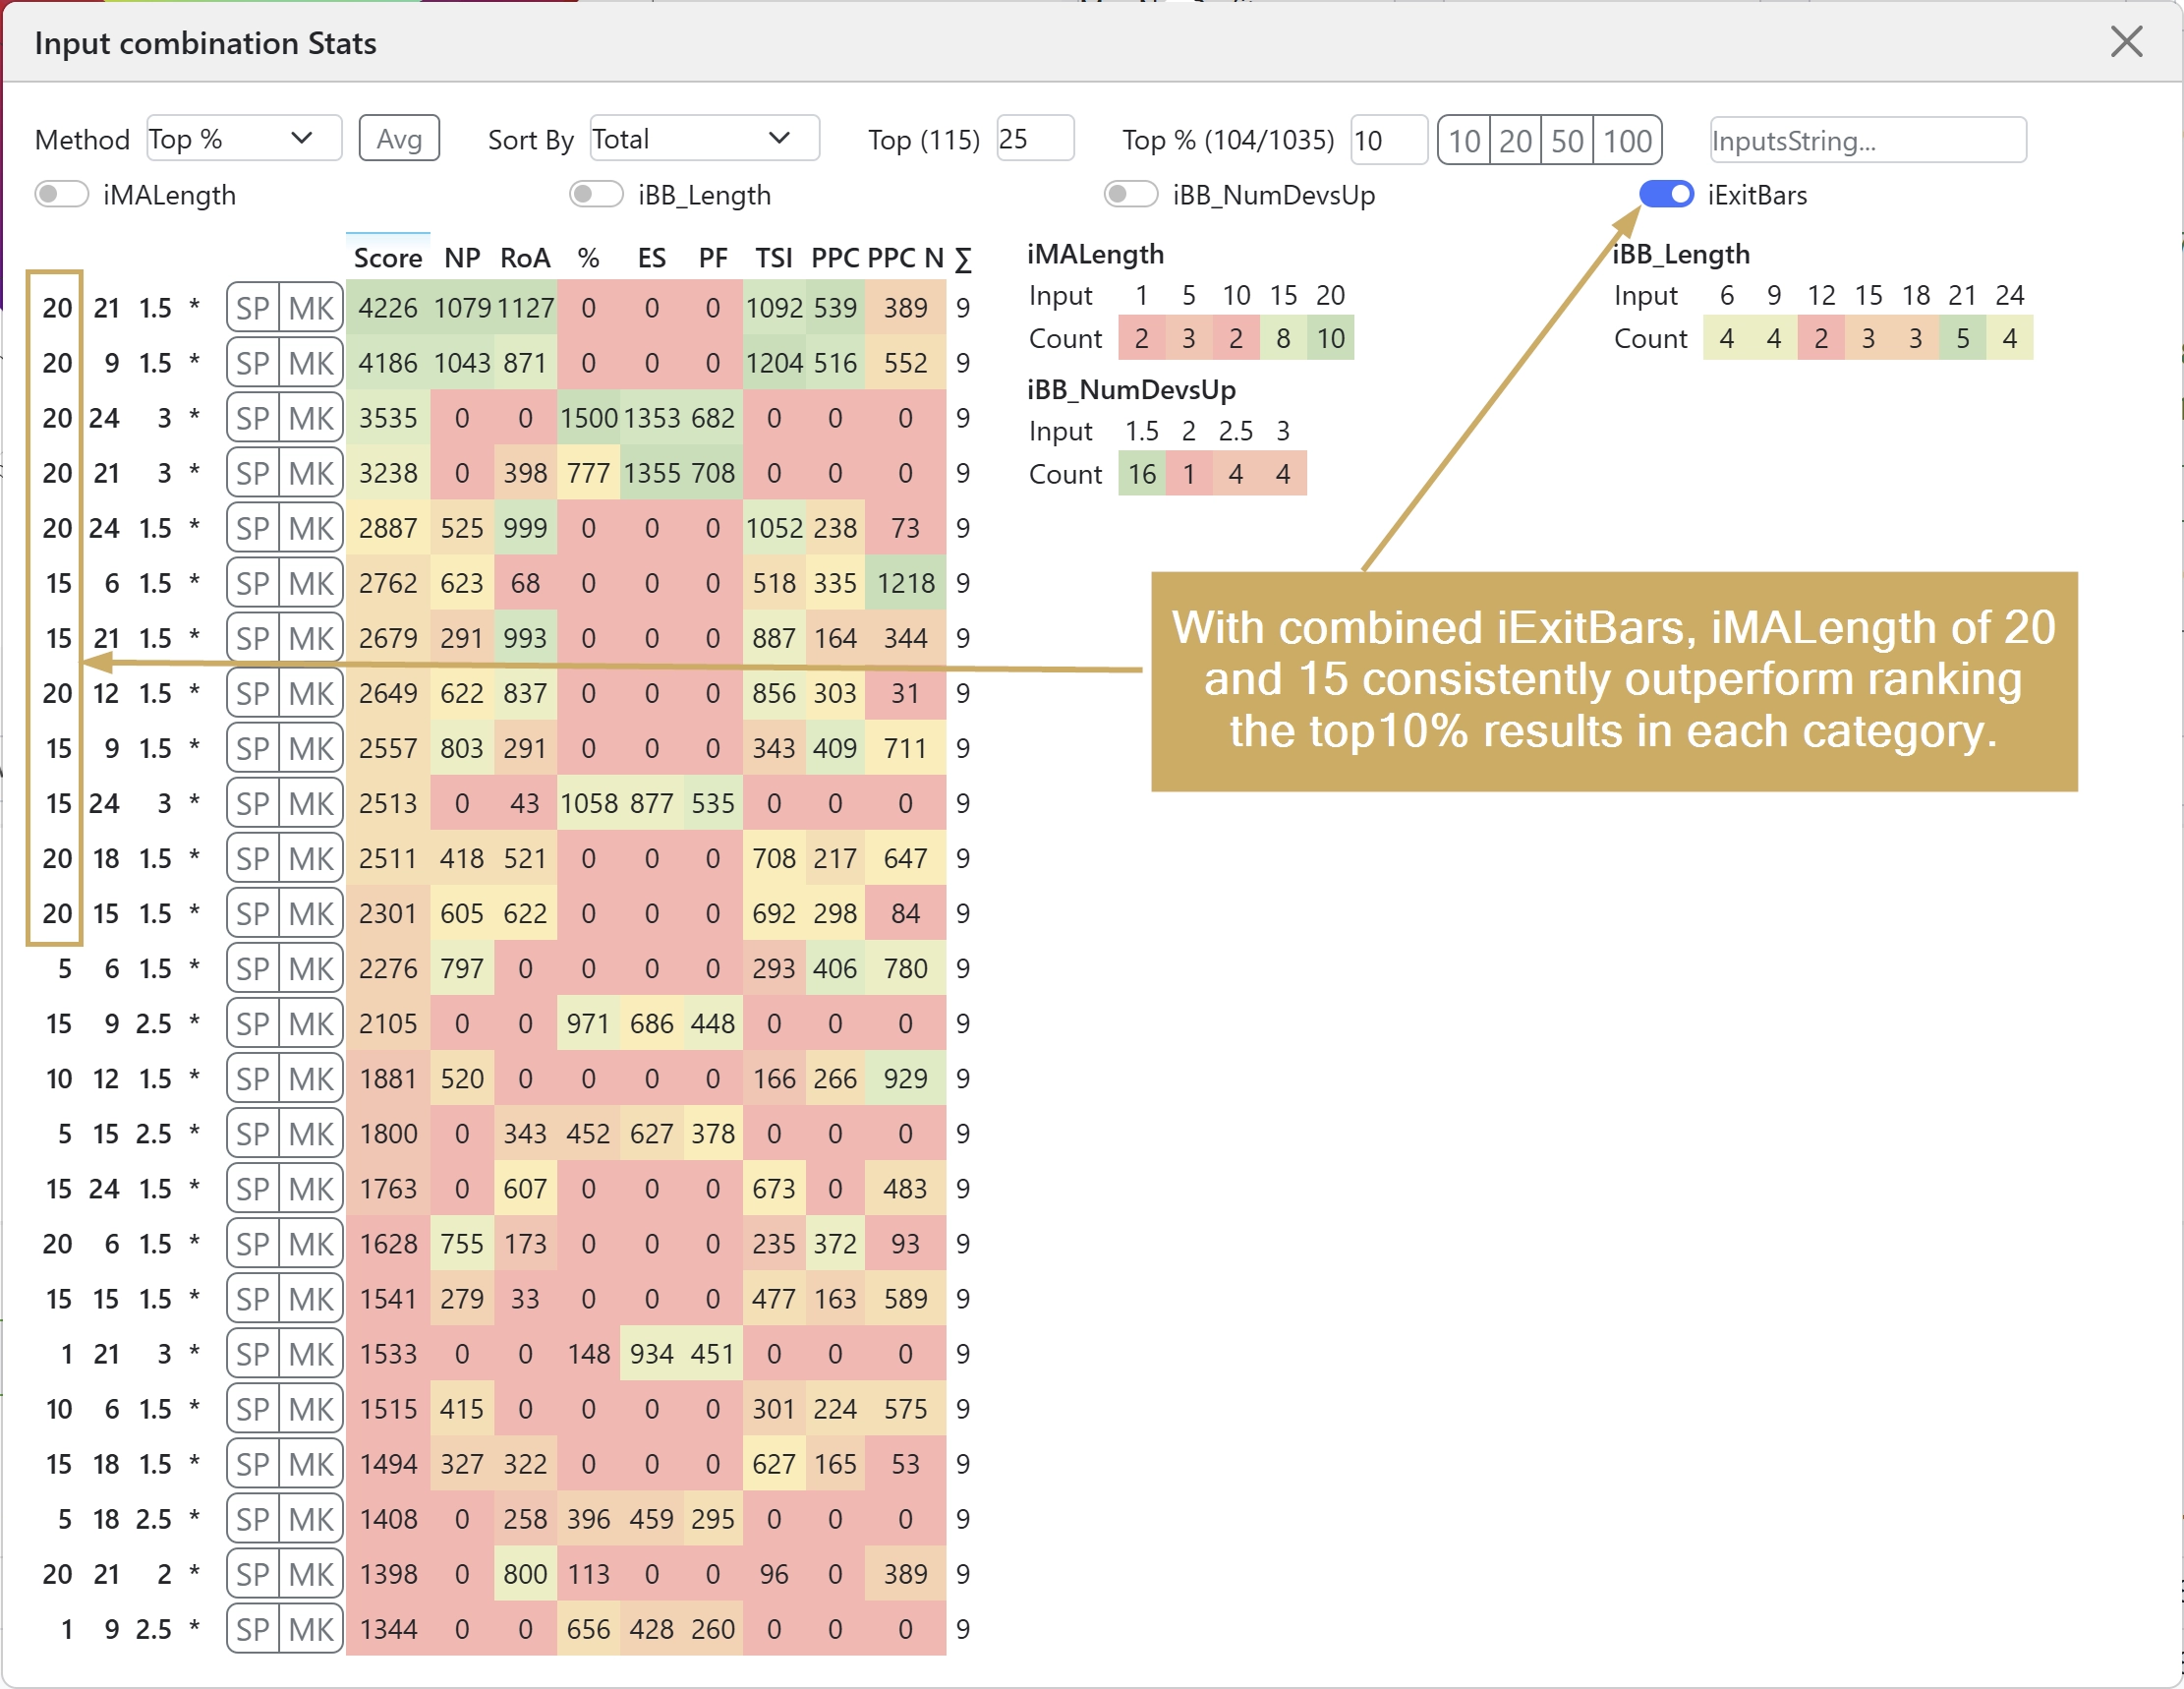
Distribution of Profitable Trades (%):
Distribution of Net Profit:
In the next step, the results are filtered to include only parameter combinations with iMALength = 20.
Distribution of Profitable Trades (%) and Net Profit by iBBLength:
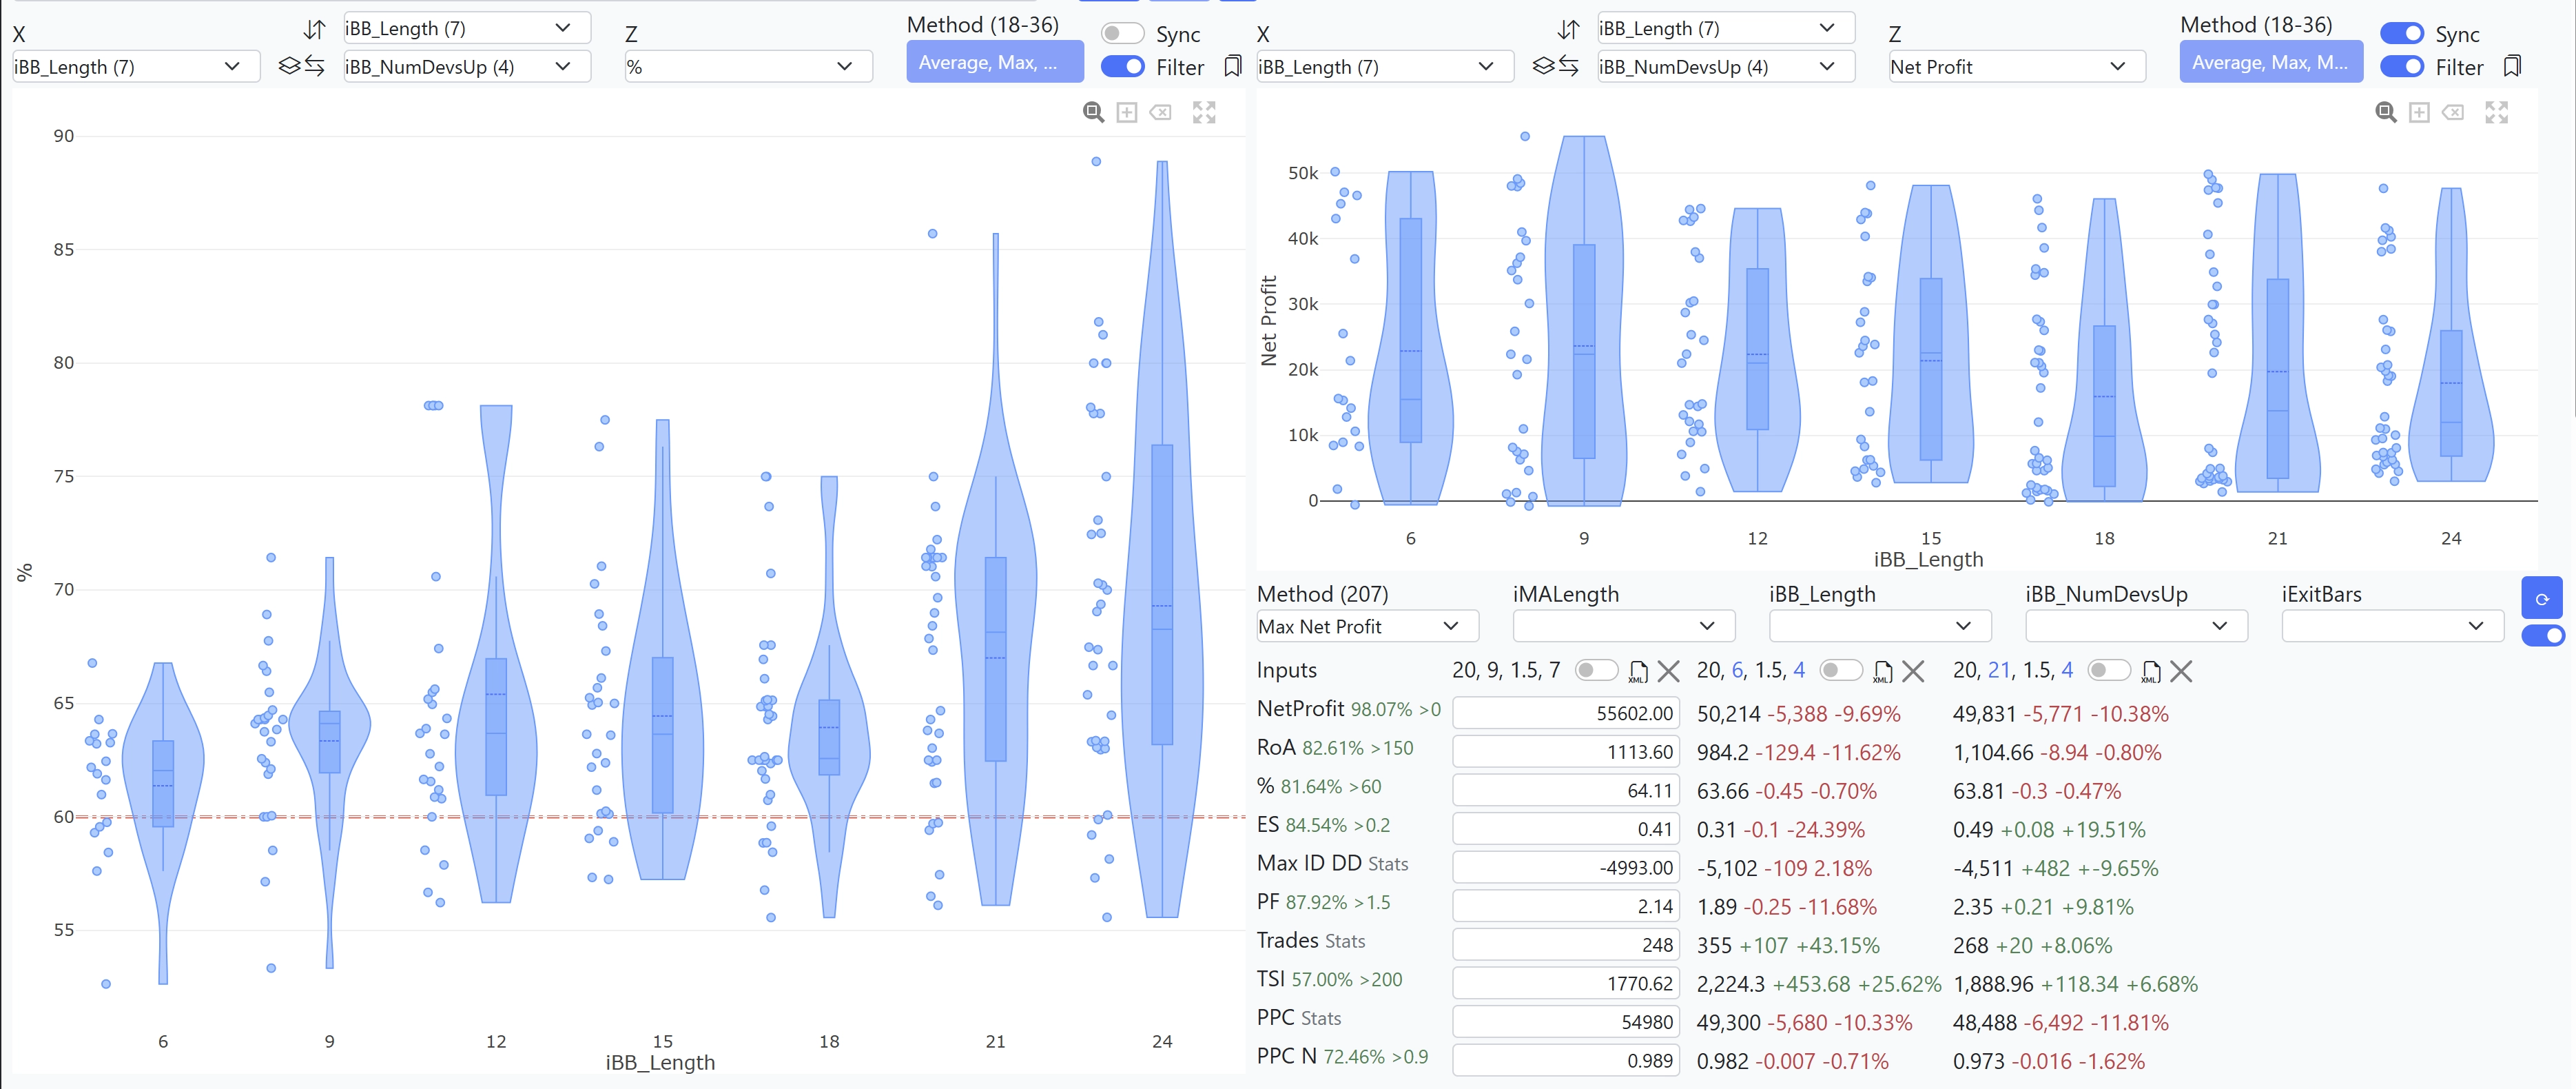
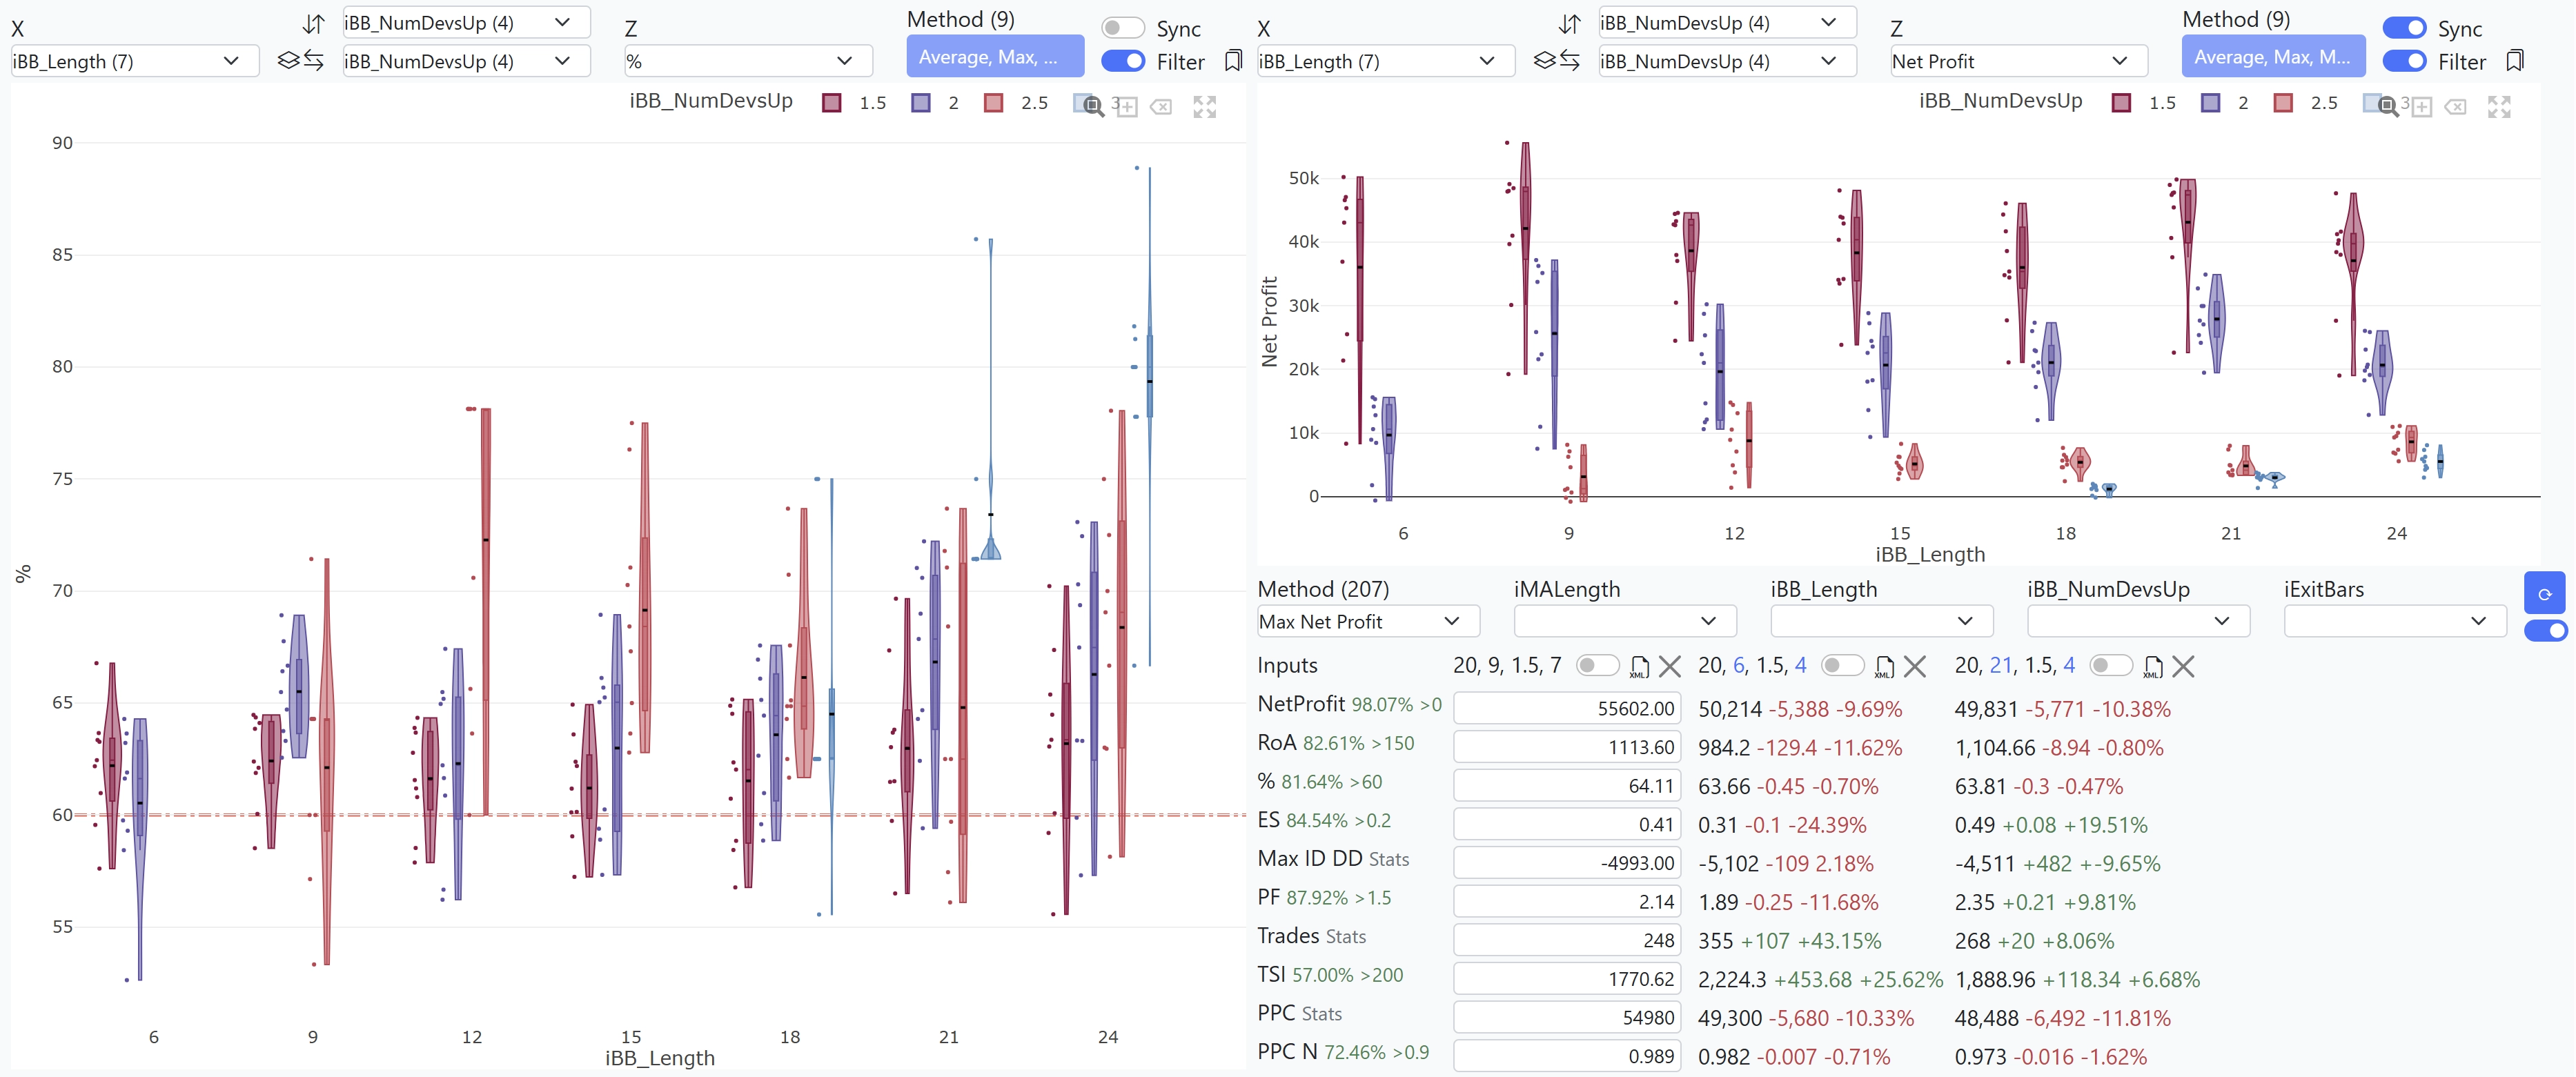
A clear relationship can be observed between the Bollinger Band threshold and the resulting trade characteristics. The percentage of profitable trades increases as iBBNumDevsUp increases, corresponding to wider Bollinger Bands and therefore more extreme signal thresholds.
Net profit, however, tends to increase with lower values of iBBNumDevsUp. Narrower Bollinger Bands generate signals more frequently, resulting in a larger number of trades. The higher trade frequency can therefore produce greater cumulative net profit even when the percentage of profitable trades is lower.
Historical backtests should not be interpreted as guarantees of future performance. In addition, the results across the tested parameter range are relatively similar, with no single parameter combination demonstrating an overwhelmingly superior outcome.
For the subsequent analysis, we therefore select parameters from the middle of the tested range rather than choosing the historically best-performing combination. The selected values are iBBLength = 15 and iBBNumDevsUp = 2.0.
This choice is intended to provide a representative parameter set while reducing the emphasis on selecting parameters solely on the basis of historical optimization results.
Results by Exit Bars:
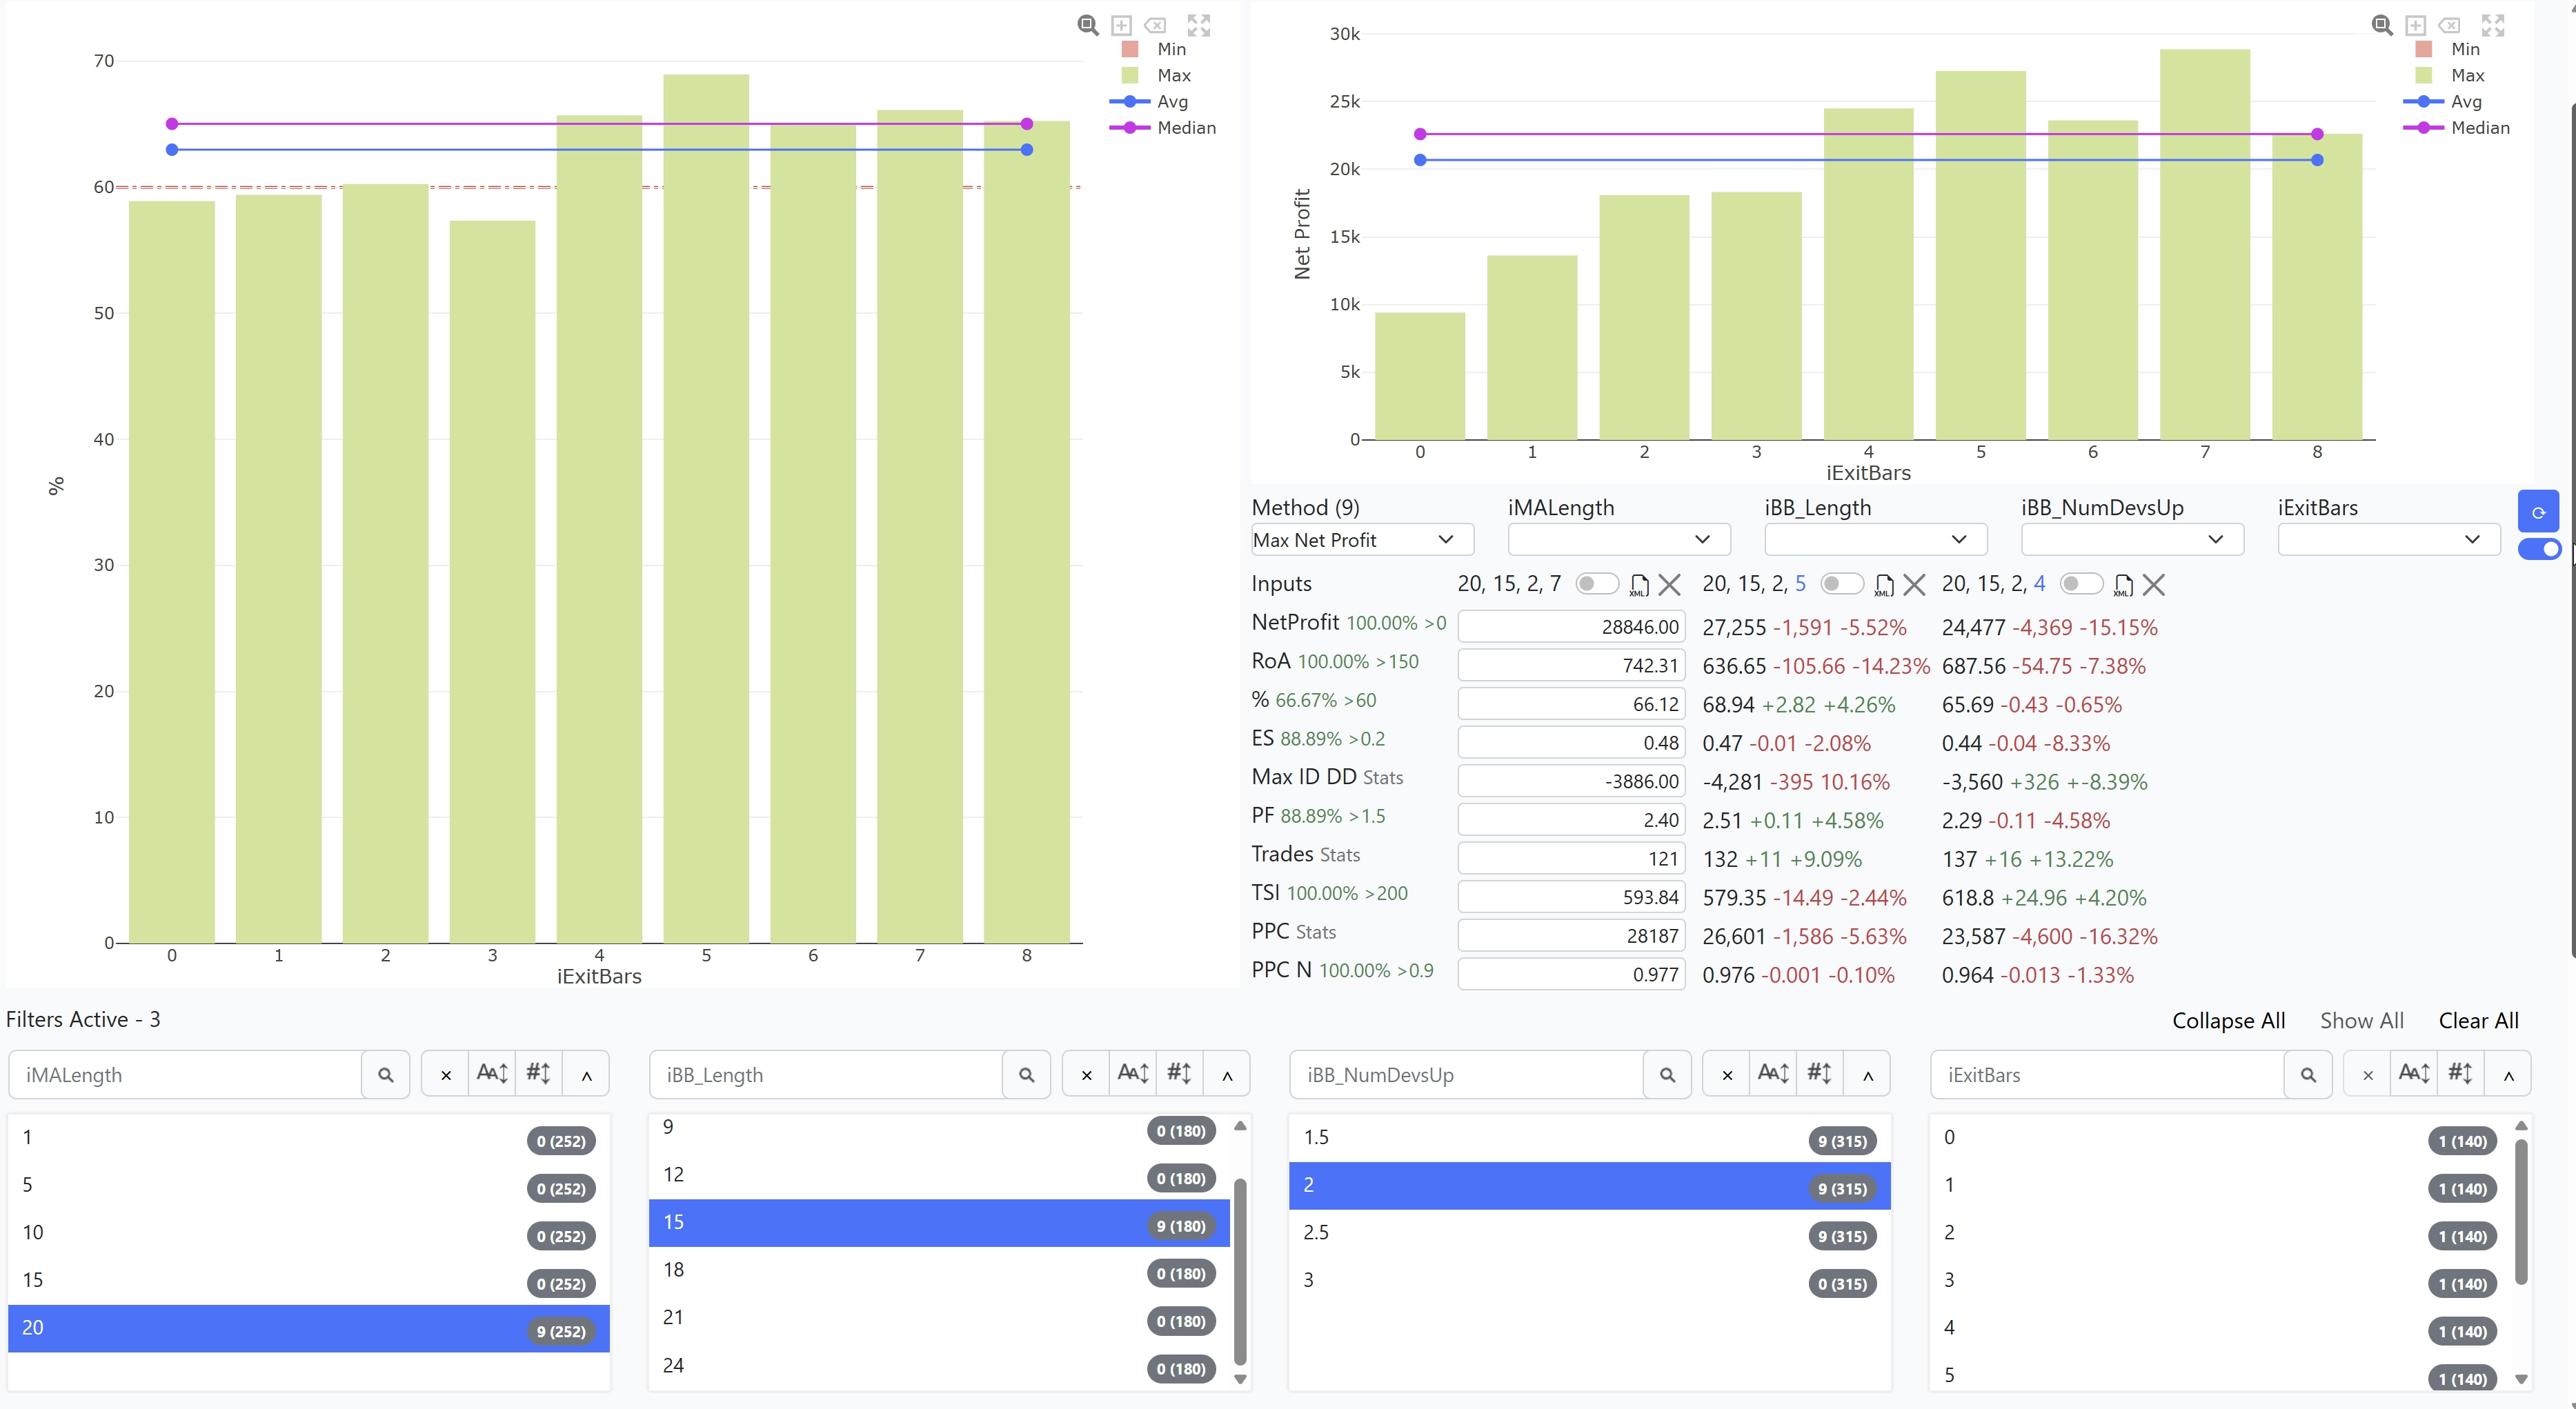
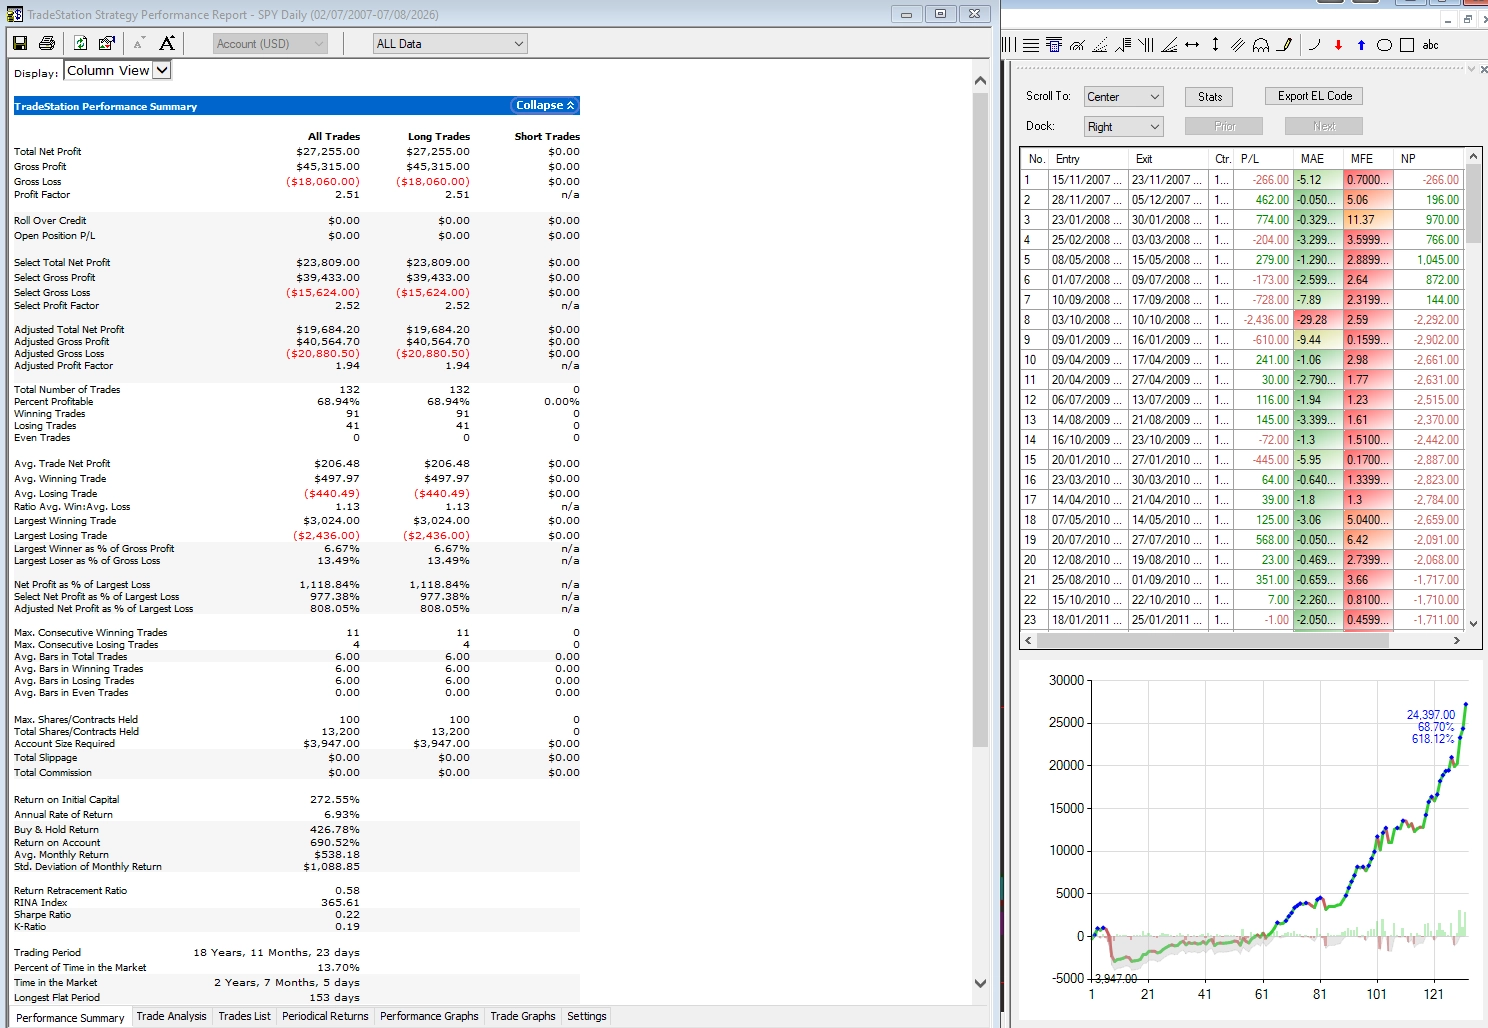
An exit after five bars provides a reasonable representation of the performance observed across the tested holding periods. We therefore use iExitBars = 5 for the subsequent examination of the strategy and its signals on the price chart (no audio).
The following performance report and equity curve show the results produced by this representative parameter configuration.
Performance Report and Equity Curve:
SPY Short
The short-side results are arguably of greater interest, as long-only SPY strategies benefit from the market's long-term upward bias. Short trades, by contrast, do not have this same structural advantage, making profitable and consistent short-side results particularly noteworthy.
The following video provides an overview of the results across the tested parameter combinations. The same top-down analysis described in the SPY long section is used to examine the distribution and robustness of the results.
Overview of Backtest Optimization Results (no audio):
For a closer examination of the signals on the price chart, we select a representative parameter combination from the better-performing region of the results:
- iMALength = 15
- iBBLength = 15
- iBBNumDevsDn = -2.0
- iExitBars = 5
The following video shows the resulting short signals in the context of the underlying SPY price action (no audio):
Conclusion
The results of this study suggest that the Volume Put/Call Ratio can provide useful information about short-term market sentiment, particularly when unusually bullish or bearish readings are evaluated relative to their recent historical range.
Using Bollinger Bands rather than fixed thresholds allows the definition of sentiment extremes to adapt to changes in the underlying level and behavior of the Put/Call Ratio over time. Smoothing the ratio and testing a broad range of Bollinger Band parameters further allows us to evaluate whether the observed effects are robust across different specifications rather than dependent on a single optimized setting.
Across the markets and trade directions examined, the results show that fading extreme Put/Call Ratio readings can exhibit a measurable tendency toward subsequent mean reversion. However, the strength of that tendency varies depending on the market, signal threshold, smoothing parameters, and holding period.
More importantly, the objective of this study is not to identify the historically most profitable parameter combination. A single highly optimized result has limited value if nearby parameter combinations do not produce similar behavior. Greater confidence can instead be placed in areas where a broad range of parameters produces reasonably consistent results.
As with any historical backtest, these results describe what occurred during the period studied and do not guarantee similar behavior in the future. Transaction costs, slippage, changing option-market structure, and changing market regimes may all affect realized performance.
The Volume Put/Call Ratio should therefore not be viewed as a standalone trading system. Its greater value may be as a quantitative sentiment measure that can complement other forms of market analysis and help identify periods when positioning and sentiment have moved toward historical extremes.
Writer: Steffen (tradeatomy.com)
No investment advice or recommendation are provided or implied. All information is for educational purposes only. Always conduct your own research and consult a qualified financial professional before making investment decisions.
Please also read our Disclaimer.
Comments (2)
We welcome all comments related to market timing. We do not welcome political and insulting comments, however, and comments of a political nature belong elsewhere and could lead to removal and blocking the originator of such political comments.
