1. Features
- The app uses Peter’s refinements of J.M. Hurst’s theories of projecting future prices for stock market indexes and other markets.
- The app provides the user with default offsets that have proven invaluable for market analysis.
- Those default offsets can be used with weekly, daily, and even intraday charts.
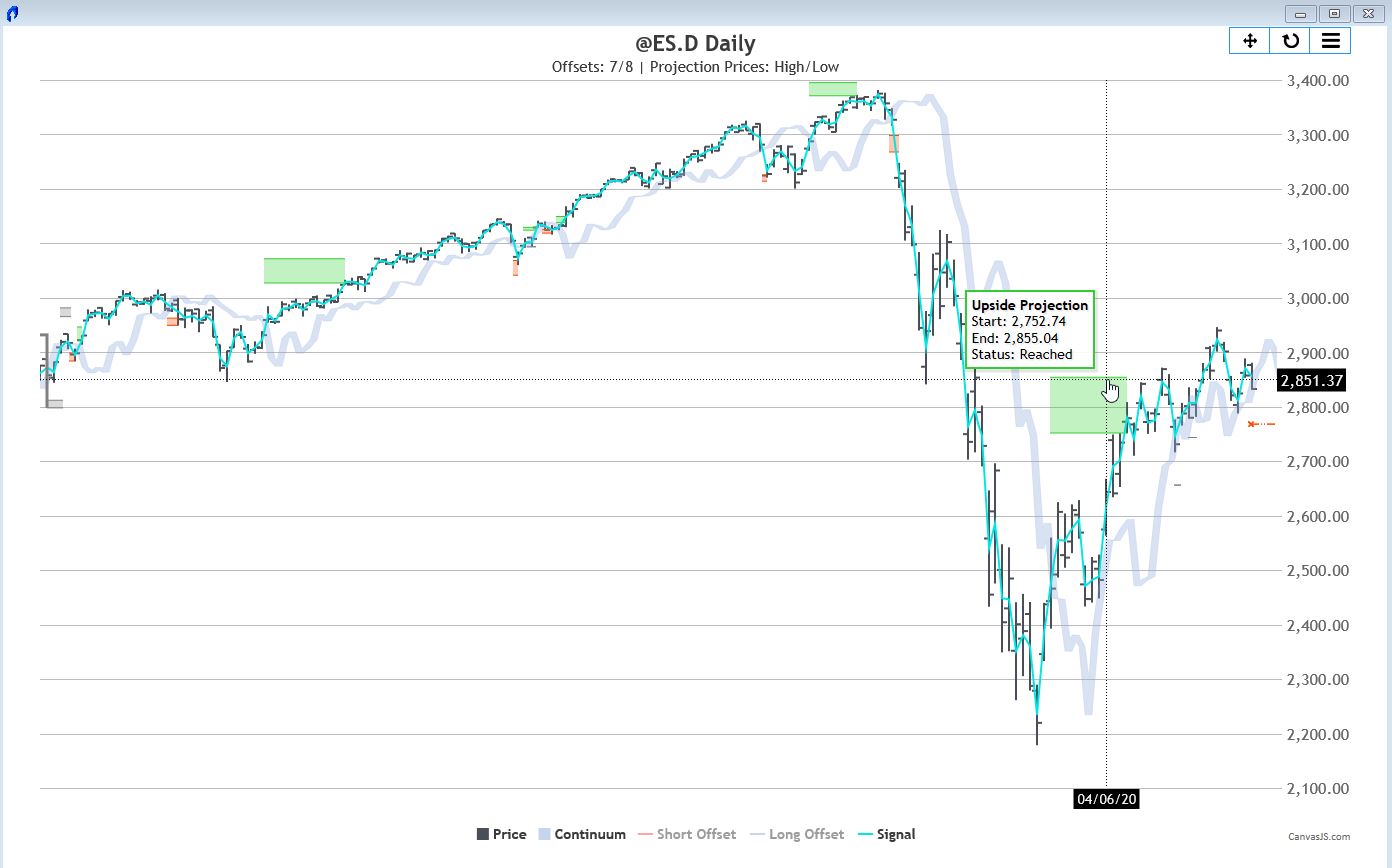
- By using these default offsets, the user will see specific price predictions appear on the charts as rectangles.
- See Peter’s chapter in New Thinking in Technical Analysis: Trading Models from the Masters – Rick Bensignor, Wiley 2000. The chapter can be downloaded here.
- Your TradeStation platform must be version 10 to support the indicator.
1.1 WebChart
The WebChart provides a clearer picture of the exact fractional offsets and comprises the continuum, which is created by encompassing the space between the two offsets.
Like on the TradeStation charts, a click on a projections border reveals the market structure points used for the projection.
It can be opened on every load (see 2. Customize Indicator) or from the right click context menu (see 1. Features – b. Right Click Context Menu).
1.2 Right Click Context Menu
The right click context menu allows for a very quick access to frequently used settings:
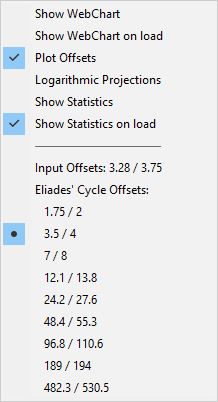
- Show WebChart
- Toggle the user inputs Show WebChart on load and Plot Offsets.
- Toggle between linear and logarithmic projections.
- Switch between the User Input Offsets and Peter Eliades' Offsets that are provided depending on the market and the chart time frame.
- Show Statistics and toggle Show Statistics on load. (Automatically shows the statistics on every load of the indicator). The input Record Statistics must be turned on.
- The offsets projectons adapts to space available to the right. If you want to see the projections extend further to the right after the last bar on the chart, you can increase the Space to the Right value in the window settings. (How to access the window settings)
The context menu is accessed by right clicking on either the signal line or the offset lines.
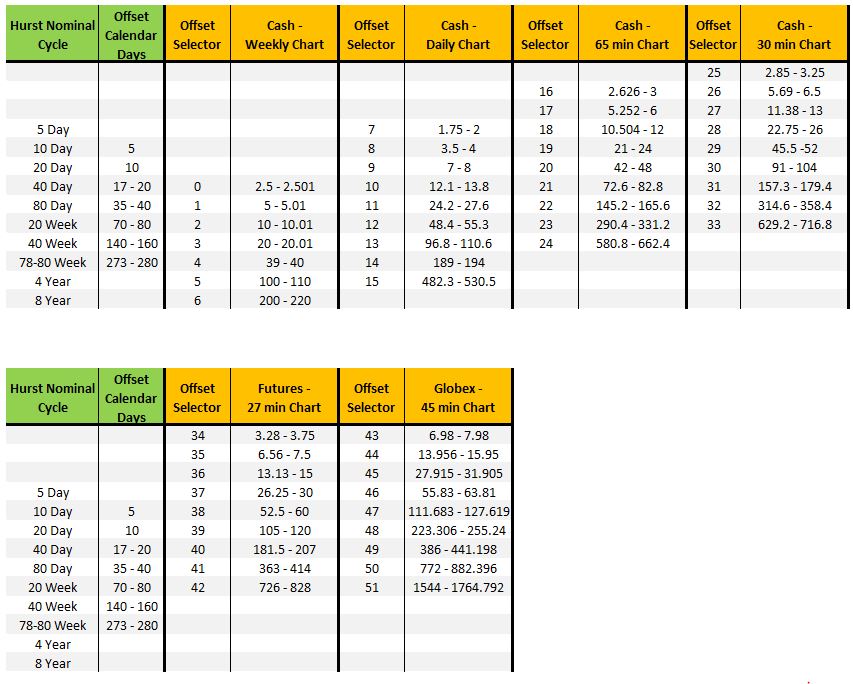
1.3 Eliades' Cycle Offsets
The app comes with the Eliades' cycle offsets accessible from the right click context menu. These are the time-proven cycles for stock market indices that Peter used for decades. They are derived from JM Hurst's original work on cycles.
There are different cycles for the different markets (futures, cash/etf) and timeframes.
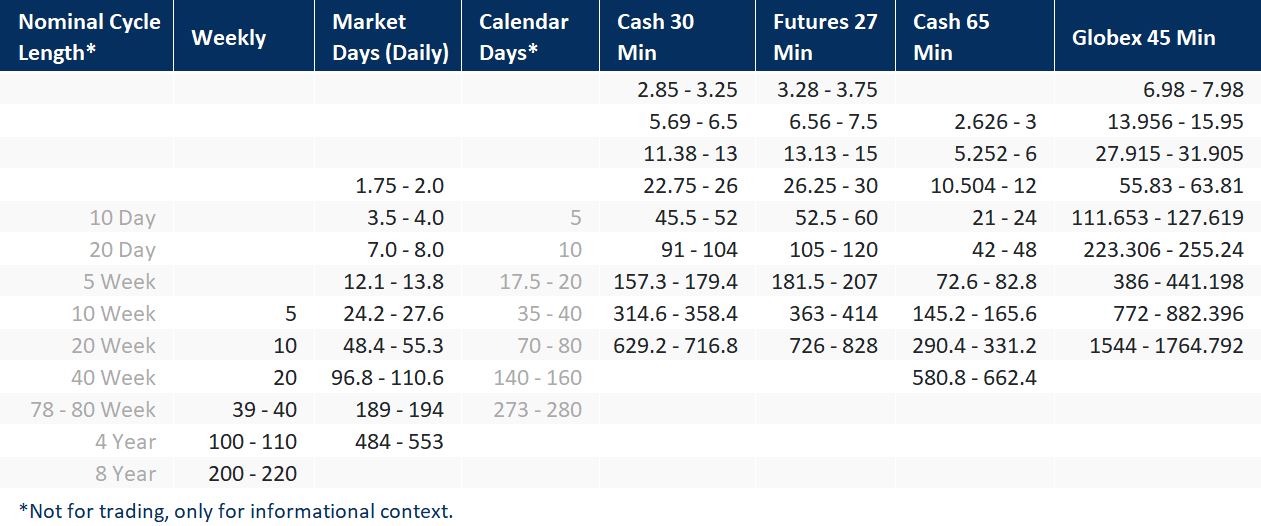
It shows you that the offsets are almost all interrelated. So, for example, when you want to see if nominal 10 Week projections have been generated, you can analyze a 5 week offset on a weekly chart, 24.2-27.6 day (market days) offsets on a daily chart, 314.6-358.4 periods offsets on a 30 minute cash chart, 363-414 periods offsets on a 27 minute futures chart (daytime prices only—not including Globex), 145.2-165.6 periods offsets on a 65 minute cash chart, and 386-441.198 periods offsets on a 45 minute Globex chart (including all 24 hours of trading).
Notice the column headed Calendar Days. Those offsets were originally used in Hurst’s seminal work on cycle projections. Charts were constructed with spaces for Saturdays, Sundays, and holidays. Now you can see that a nominal 10 day projection is generated by its half-span offset, namely 5 calendar days, and you can see the reason why some nominal cycles don’t seem to use half-spans to generate projections. What we had to do long ago was translate periods in calendar day charts to equivalent periods on market day charts. That is why a nominal 10 day projection is actually generated by 3.5-4.0 period offsets.
You can start with our sample workspace explained and available to download in chapter 5.2 Sample Workspaces.
1.4 Nicks
“Nicks” describe short-term crossings of the signal line with the continuum.
As a way of handling projections affected by noise, we introduced the Nick Filter Period.
This allows the user to filter out nicks (noise) from the projection algorithm.
1.5 Statistics
The statistics introduce a powerful way of analyzing the projections systematically.
The core of the statistics revolves around confirmed projections, their simple success rate, and measurements to better understand reached and invalidated projections.
For invalidated projections, it is measured by how much a projection was missed.
That is measured in two ways:
- Volatility adaptive percentage of the Average True Range at the time of the projection's creation.
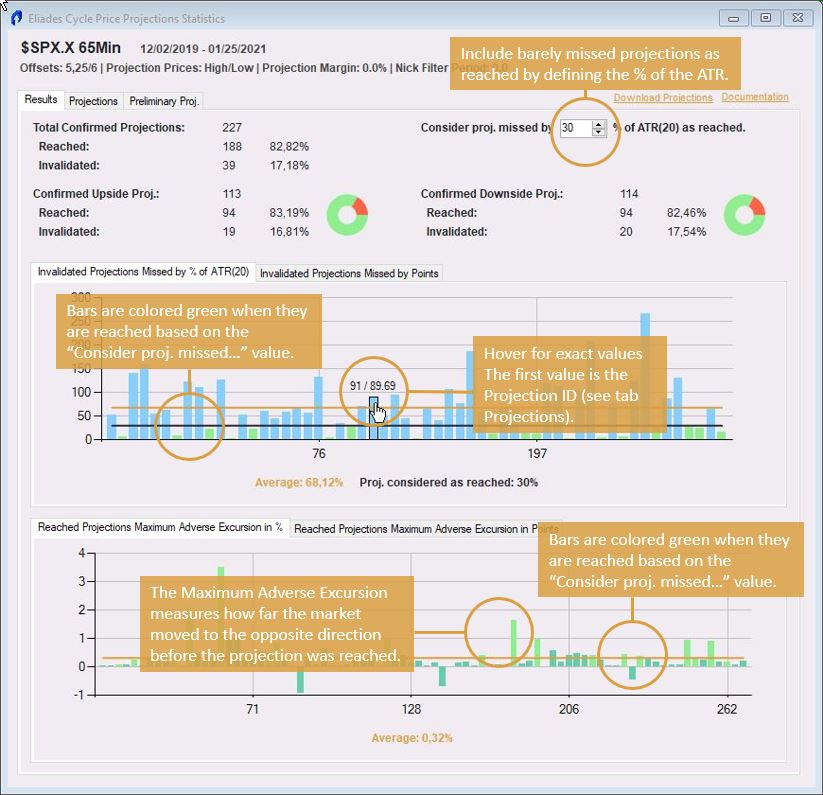
This can be simulated with the numeric input field Consider proj. missed by....
A black line on the chart Invalidated Projections Missed by % of ATR(your ATR period) shows the selected value on the chart. Bars that are considered reached by including the selected % of the ATR are colored in green. This analysis can help a trader to decide how much to "shave" from a target order or how aggressive to trail a stop-loss order when the price approaches projections. - Invalidated Projections Missed by Points is a static measurement of points.
For reached projections, we measure the maximum adverse excursion (MAE) from the close of the bar the projection was confirmed. That is how much has the price maximally moved in the opposite direction measured from the close of the confirming bar.
That is measured in two ways:
- Percentage based.
- Points based.
All chart's x-axis shows the projection id which enables mapping to the projection on the Projections tab.
Hovering the mouse over the chart shows the projection id and the exact value of the chart data point.
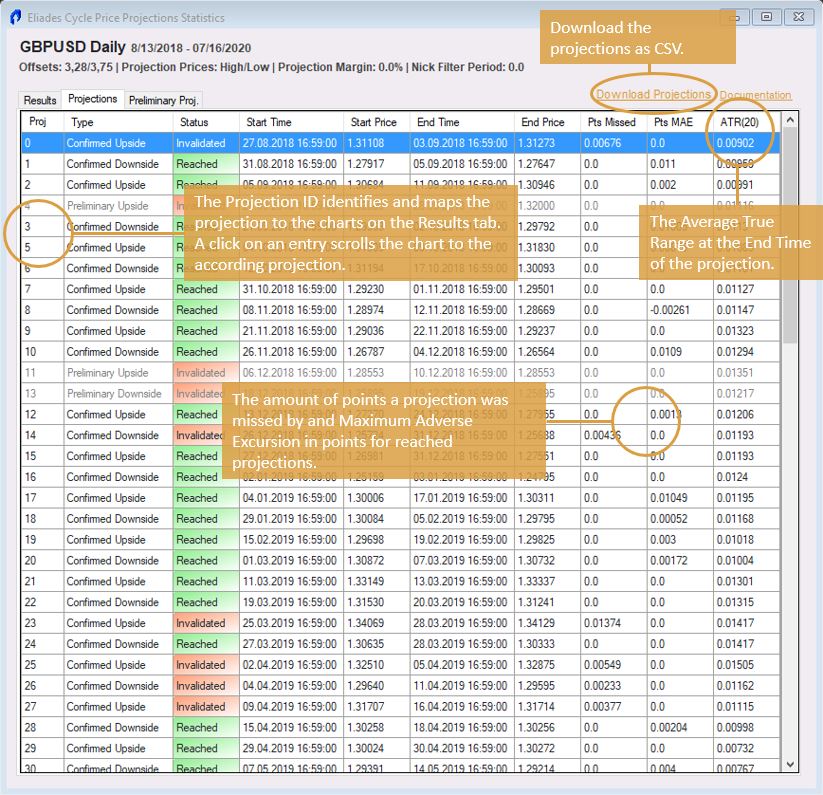
The Projections tab lists all the projections that have been recorded.
Clicking on an entry of the list makes the chart scroll to the respective projection for detailed analysis. The table also lists the points a projection was missed by (Pts Missed), the maximum adverse excursion (Pts MAE), and the value of the Average True Range(your ATR period) at the End Time of the projection. The charts on the Results tab are based on this data.
The projections can be downloaded for further analysis in csv format.
The file is saved under C:\Users\your user\Documents\StockmarketCycles\Eliades Cycle Price Projections\Export.txt
Statistics Primer Video
2. Customize Indicator
Following is a list of all the inputs, their meaning and available values.
False = off
False = off
False = off
False = off
"TopRight" or "tr"
"BottomRight" or "br"
"TopLeft" or "tl"
"BottomLeft" or "bl"
3. Updates
You will receive an Email when we provide a new version of the indicator within the downloads section.
4. Videos
4.1 Primer Eliades Cycle Price Projections
4.2 What Really Makes the market move Up and Down
4.3 What the Heck is a "Nick"?
5. Miscellaneous
5.1 Performance
The performance of the whole TradeStation platforms is greatly influenced by the amount of data on charts. In this context, it helps to think in number of bars on a chart. The program code for indicators is executed on every bar. Given the complexity of this program and multiplying it by vast numbers of bars can end up in slow performance. The program is generally able to work with large amounts of data and has been optimized for maximum speed and performance. However, a lot of calculations do end up requiring patience. We advise using fewer data in everyday use (in general, for most indicators). Longer backtests can either be processed in time slices, or be started before preparing a coffee :).
5.2 Sample Workspace
The following workspace[s] is provided as a suggestion for subscribers for an analysis page for using the Eliades Cycle Price Projection app. Those of you who are long-time TradeStation users probably have your own habits and ideas for setting up our indicator and are, of course, free to do so. For newcomers, we have provided five charts with the five timespans used by our app to generate price projections. Once you become accustomed to the program, you will likely set up your own workspaces.
The daily chart can be used for virtually any market, cash indexes, futures, commodities, FOREX etc. For each chart and time span, we have entered default parameters. The ones we entered are arbitrary and simply used as markers for the time span. Each chart and time span has its own individualized offsets that have been built into the program. A right-click on the offsets or the “signal line” will bring up the appropriate offsets for each time span. These are Peter Eliades’ offsets that were derived from the original Hurst cycle research. You are free to experiment with other offsets which can be changed by going to the inputs for the indicator. If you change those inputs, the offsets you enter will then show up as the Input Offsets when you right click on a chart offset. More in chapter 1.3 Eliades' Cycle Offsets
65 minute charts and 30 minute charts are meant to be used with cash index and equity markets whose daytime trading hours go from 9:30 am ET to 4:00 pm ET.
The two workspaces have their symbol linked (see the button in the chart window title bar) so whenever you change one of these, the other symbol changes, too.
27 Minute charts are meant to be used with Index Futures markets, daytime hours only, mamely 9:30 am ET to 4:15 pm ET.
45 Minute Charts are meant to be used for Globex analysis for entities like @ES which trade almost 24 hours/day.
On the daily chart, we have also provided two versions of the app. One of them deals with closing price projections (it uses the “Close” as the input signal), the other with intraday projections, which use the “MedianPrice” as the input signal. You can change between the “close” and the “intraday” by right-clicking on the chart background and then going to “Studies” > “Enable/Disable Studies” (TradeStation 10). When using closing price projections, you should display a line chart to clarify the relationship between the projection and the price shown on the chart. MedianPrice signal lines will result in projections for extremes on a bar chart. Closing price projections will be for closes, not extremes on the bar chart. Typically, closing price projections would only be used on a daily chart.
Download the sample workspace using the button below. The workspace is a .zip file and must be unzipped before it is used. You can put the file at any location on your computer. The default location is Documents\TradeStation 10.0\Workspaces (TradeStation 10). Double-click the .tsw file to open the workspace.
5.3 Chris' RadarScreen Indicator
Our fellow trader and Eliades' Cycle Price Projections user Chris developed an early warning indicator for crossings.
He is so generous to let us share it with the community. Great spirit! Thank you Chris!
Please note the following:
- The indicator is written by Chris for his personal use and neither Chris nor we are guaranteeing the flawless functionality of the indicator.
- Chris has no access to the exact offsets and continuum values. The indicator is working with approximate values (as shown in column Offset Settings).
- We do not provide support or maintenance for the indicator.
- The indicator is open source. You can read/adapt the code as per your wishes.
Here is a example of how the indicator looks:
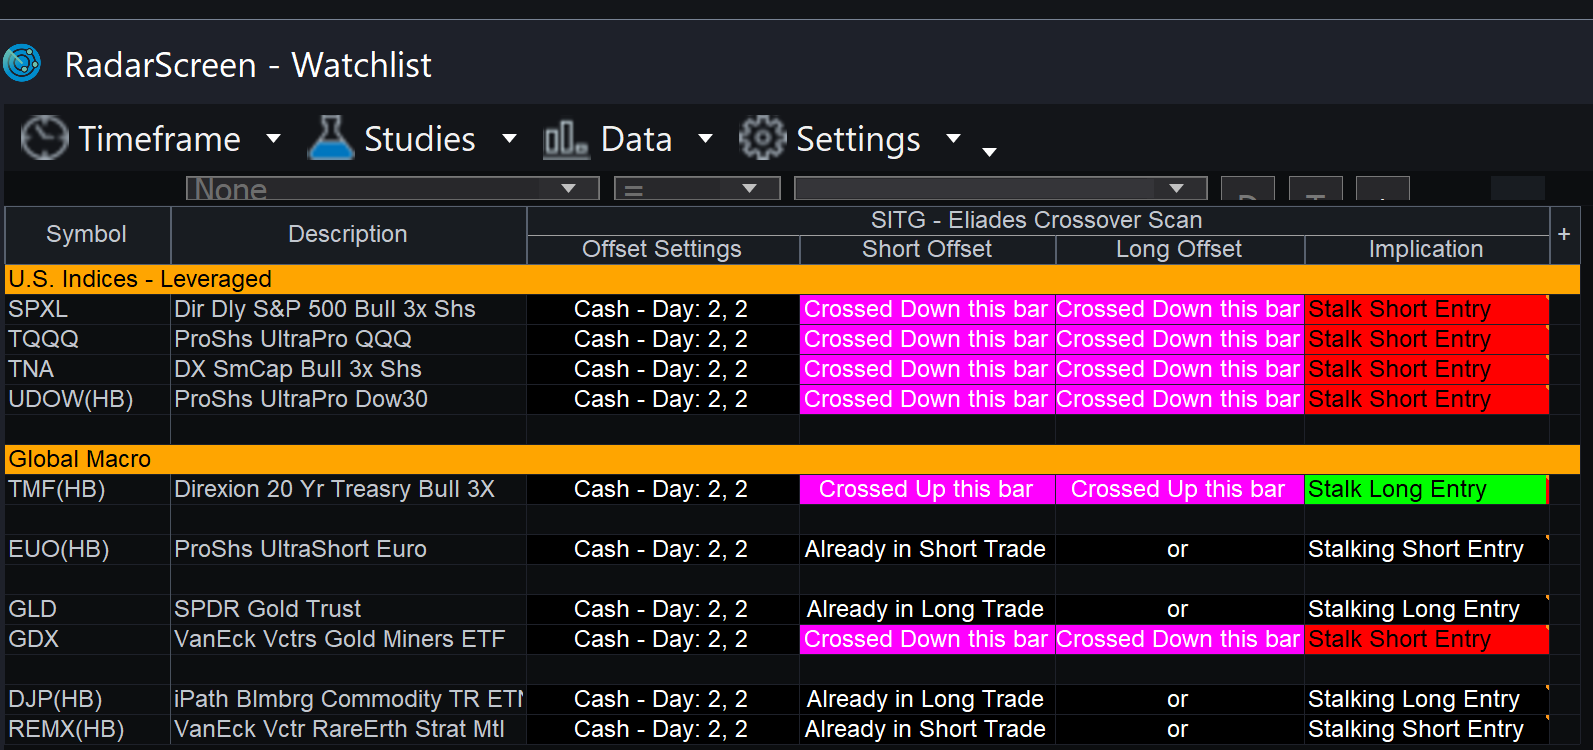
Chris defined an input called Offset_Combination_Selector for the selection of the offset pairs:
In order to use the indicator, download the zip using the button below. You can install the indicator by double-clicking the .eld file in the zip. The indicator is called SITG - Eliades Crossover Scan.