1. Features
- The app uses Peter’s refinements of J.M. Hurst’s theories of projecting future prices for stock market indexes and other markets.
- The app provides the user with default offsets that have proven invaluable for market analysis.
- Those default offsets can be used with weekly, daily, and even intraday charts.
- By using these default offsets, the user will see specific price predictions appear on the charts as rectangles.
- See Peter’s chapter in New Thinking in Technical Analysis: Trading Models from the Masters – Rick Bensignor, Wiley 2000. The chapter can be downloaded here.
- This documentation is for the TradingView version of Eliades Cycle Price Projections.
1.1 Eliades' Cycle Offsets
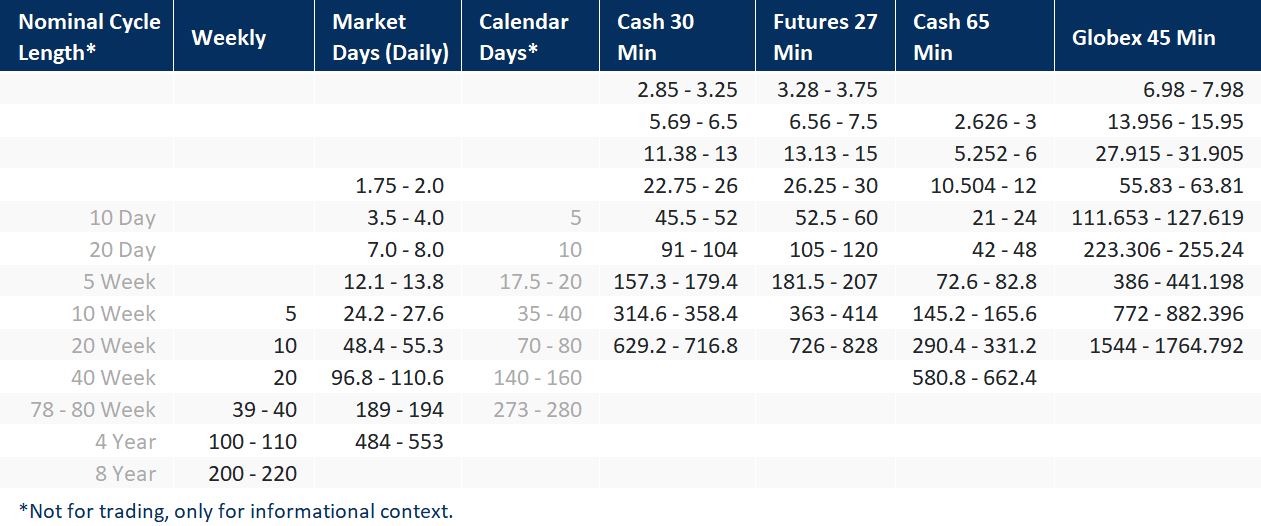
The app comes with the Eliades' cycle offsets selectable from the indicator Inputs. These are the time-proven cycles for stock market indices that Peter used for decades. They are derived from JM Hurst's original work on cycles.
There are different cycles for the different markets (futures, cash/etf) and timeframes.
It shows you that the offsets are almost all interrelated. So, for example, when you want to see if nominal 10 Week projections have been generated, you can analyze a 5 week offset on a weekly chart, 24.2-27.6 day (market days) offsets on a daily chart, 314.6-358.4 periods offsets on a 30 minute cash chart, 363-414 periods offsets on a 27 minute futures chart (daytime prices only—not including Globex), 145.2-165.6 periods offsets on a 65 minute cash chart, and 386-441.198 periods offsets on a 45 minute Globex chart (including all 24 hours of trading).
Notice the column headed Calendar Days. Those offsets were originally used in Hurst’s seminal work on cycle projections. Charts were constructed with spaces for Saturdays, Sundays, and holidays. Now you can see that a nominal 10 day projection is generated by its half-span offset, namely 5 calendar days, and you can see the reason why some nominal cycles don’t seem to use half-spans to generate projections. What we had to do long ago was translate periods in calendar day charts to equivalent periods on market day charts. That is why a nominal 10 day projection is actually generated by 3.5-4.0 period offsets.
1.2 Nicks
“Nicks” describe short-term crossings of the signal line with the continuum.
As a way of handling projections affected by noise, we introduced the Nick Filter Period.
This allows the user to filter out nicks (noise) from the projection algorithm.
1.3 Statistics
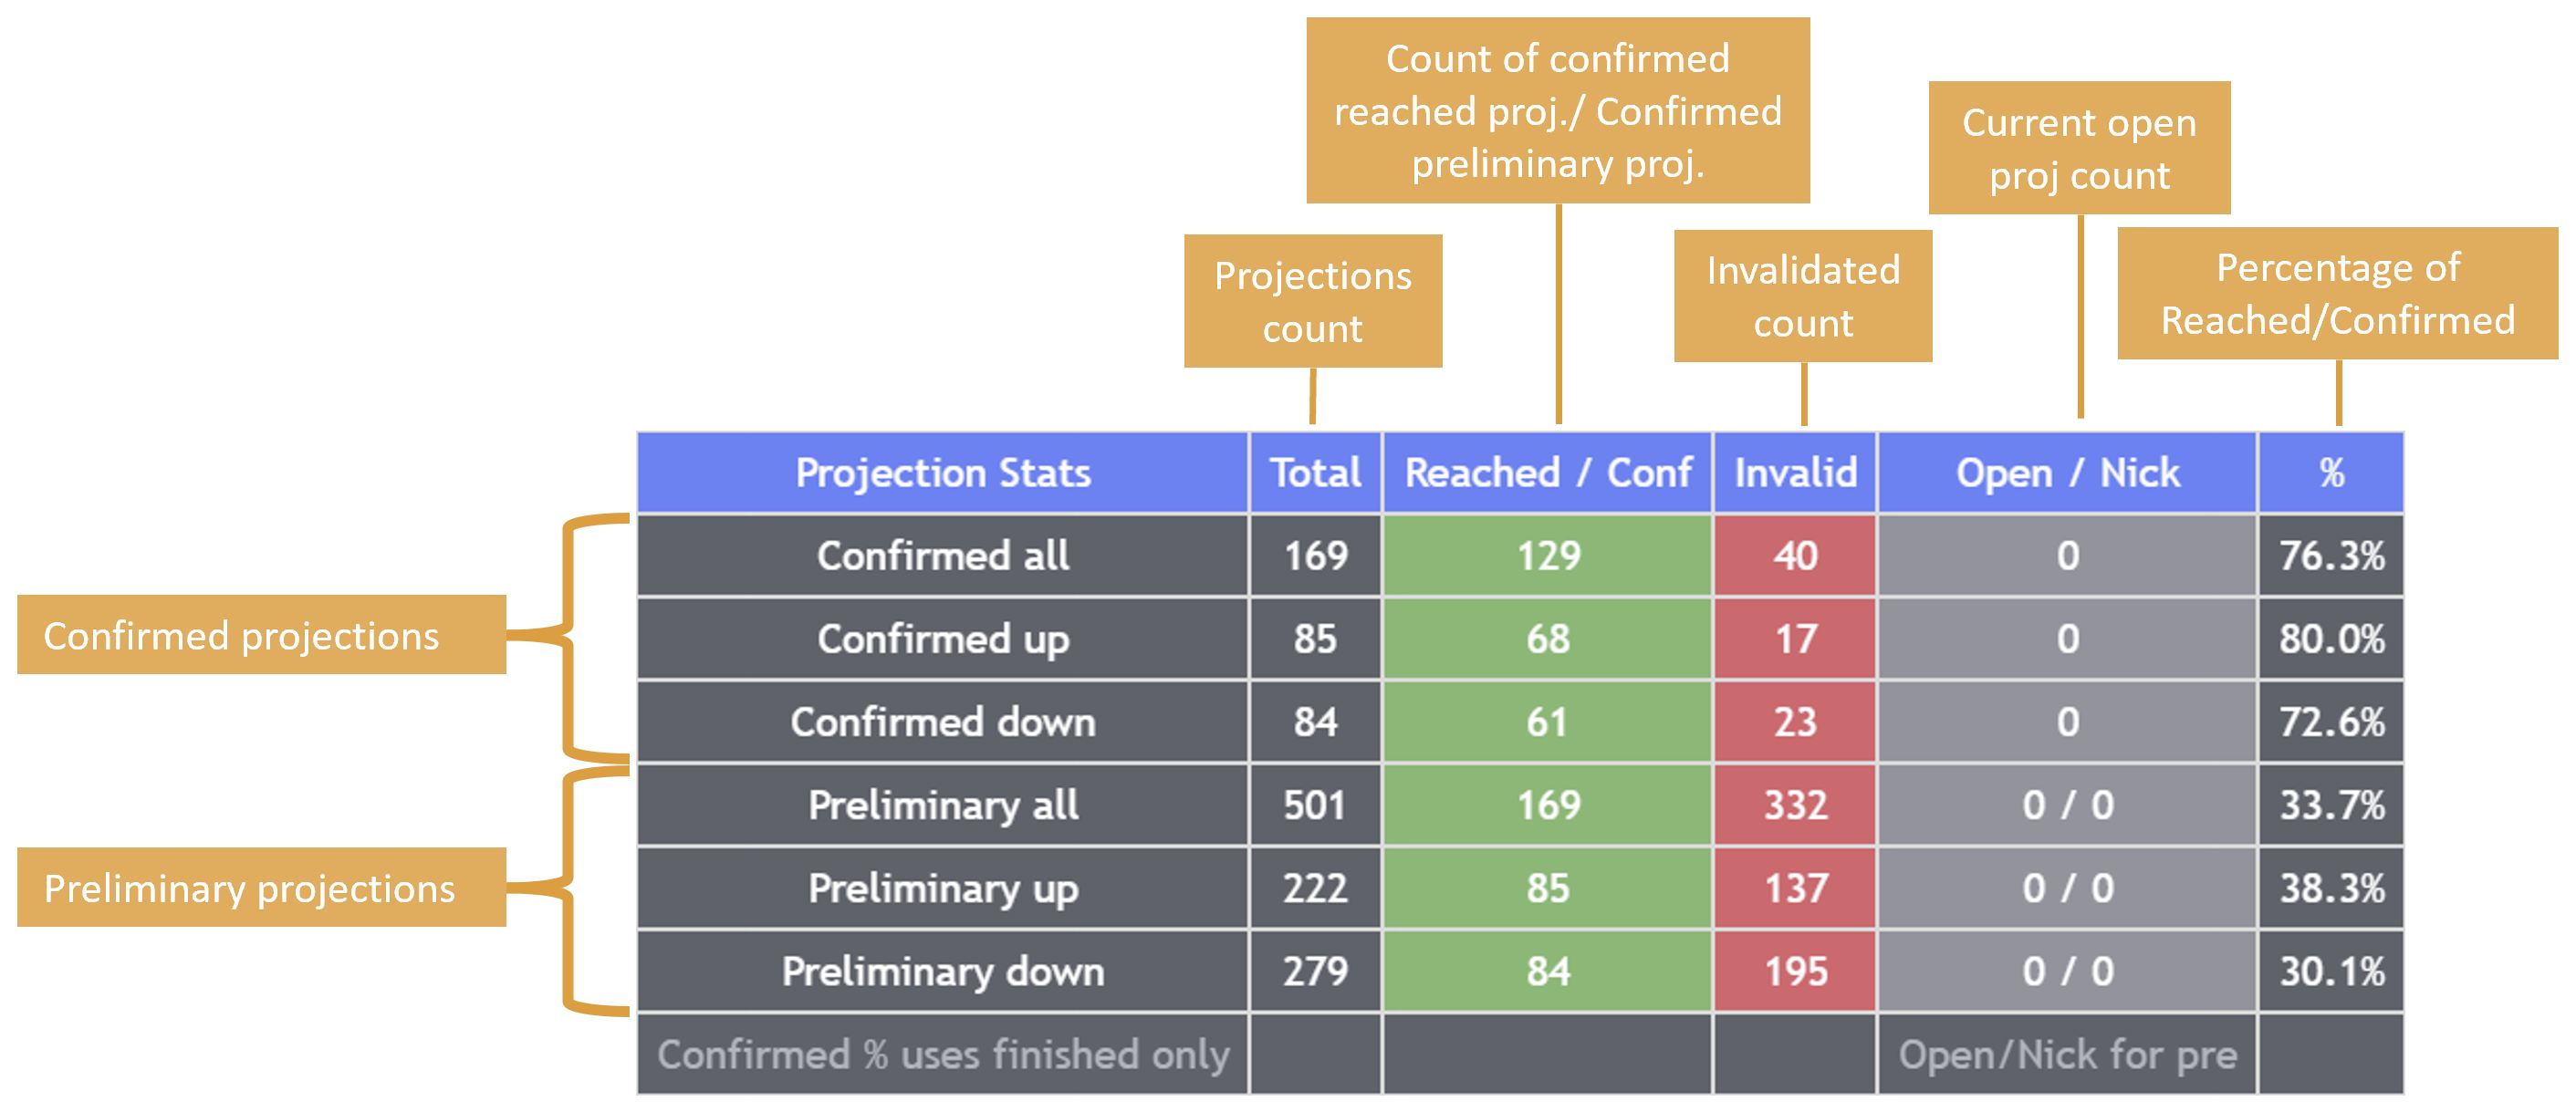
The statistics introduce a powerful way of analyzing the projections systematically.
The core of
the statistics revolves around the simple success rate of confirmed projections and the rate of
preliminary projections confirmed to
better understand reached and invalidated projections.
2. Customize Indicator
Following is a list of all the inputs, their meaning and available values.
High/Low
Unchecked = off
Unchecked = off
Unchecked = linear
Unchecked = off
Unchecked = off
Unchecked = off
Unchecked = off
Unchecked = off
3. Updates
Updates are automatically distributed and TradingView notifies you via email for updates.
You may see an “Update available” symbol when a newer version exists compared with the version on
the chart.
Click the update/refresh symbol next to the indicator name. Alternatively, remove the indicator and
add it again from Indicators → Invite-only.